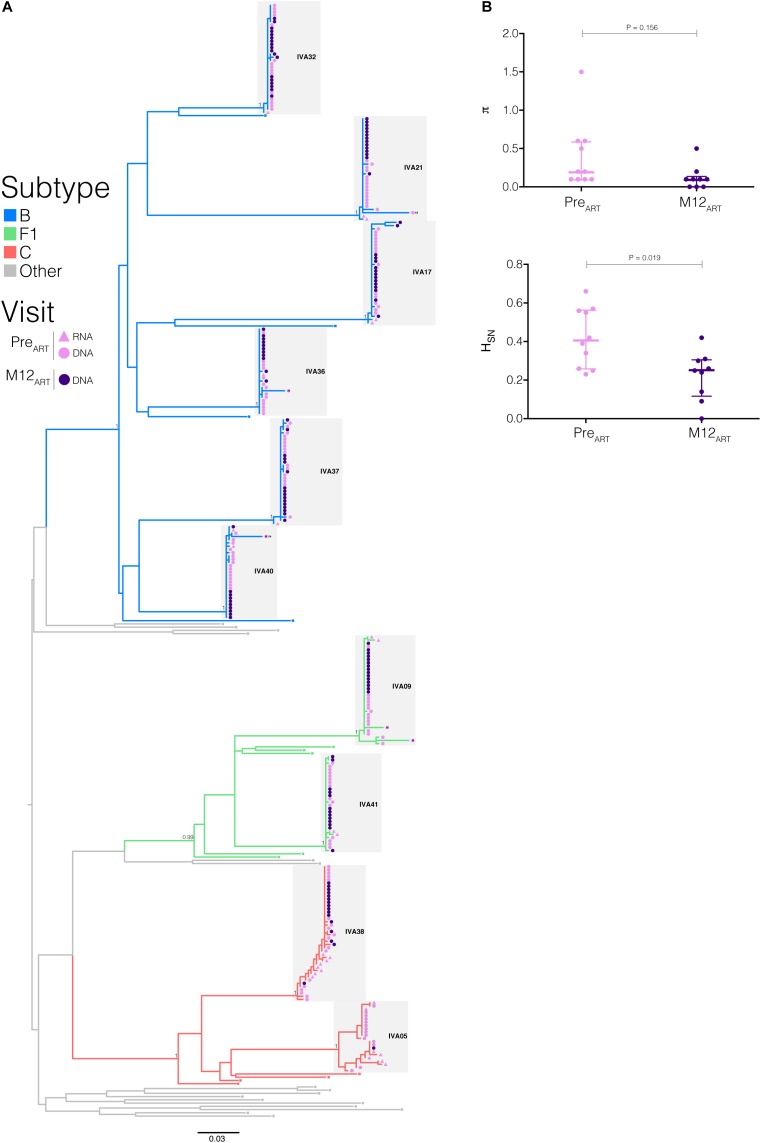
FIGURE 3.
Impact of early cART initiation on intrahost HIV-1 population diversity. (A) ML phylogenetic tree of the env sequences from PreART and M12ART visits. Tips’ shapes represent the viral compartment (proviral DNA, circles; plasma RNA, triangles) and are color-coded according to the visit (PreART, pink; M12ART, purple). The branches’ colors agree with the subtype assignment as indicated in the legend. Clusters from each individual are indicated by shaded gray boxes. Branch supports (aLRT-SH) are indicated at key nodes. Tips shapes marked with an “H” indicate the presence of APOBEC3G-mediated G to A hypermutations and X4 labels highlight X4-tropic sequences. Horizontal branch lengths are proportional to the bar at the bottom indicating nucleotide substitutions per site. (B) Mean nucleotide diversity (π) and normalized Shannon entropy (HSN) indices were calculated from the proviral env sequences obtained at PreART and M12ART visits. Thick and thin lines represent the median and interquartile ranges, respectively. P-values <0.05 were considered statistically significant.

