
Fig. 2.
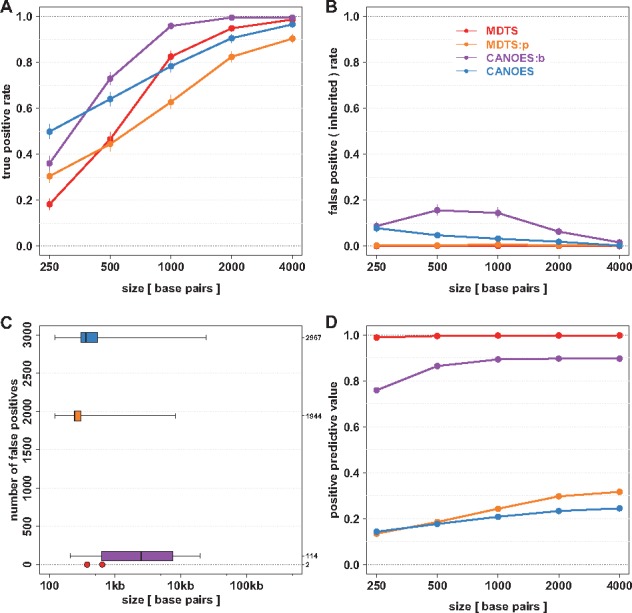
Simulation results to assess sensitivity, specificity and positive predictive value of four different algorithms to infer de novo deletions. True positive rate (sensitivity, y-axis) among 1000 iterations for simulated de novo deletions of various sizes (x-axis). Point estimates are shown as circles together with Binomial 95% confidence intervals. (B) False positive rate (specificity) among 1000 iterations for simulated inherited deletions of various sizes. (C) Number of additional false positive identifications from the simulation experiment (y-axis), with length distribution on the logarithmic scale (x-axis) shown as boxplots. MDTS with the newly defined bins only produced two additional false positives, which are shown as points. (D) Positive predictive value based on the true positive rate in panel (A) and the false positives in panel (C). Colors indicate the algorithms. MDTS and CANOES refer to the respective algorithms as implemented, MDTS:p refers to MDTS based on ‘probe-based bins’, CANOES:b refers to CANOES based on the non-uniform read depth based ‘MDTS bins’ (Color version of this figure is available at Bioinformatics online.)