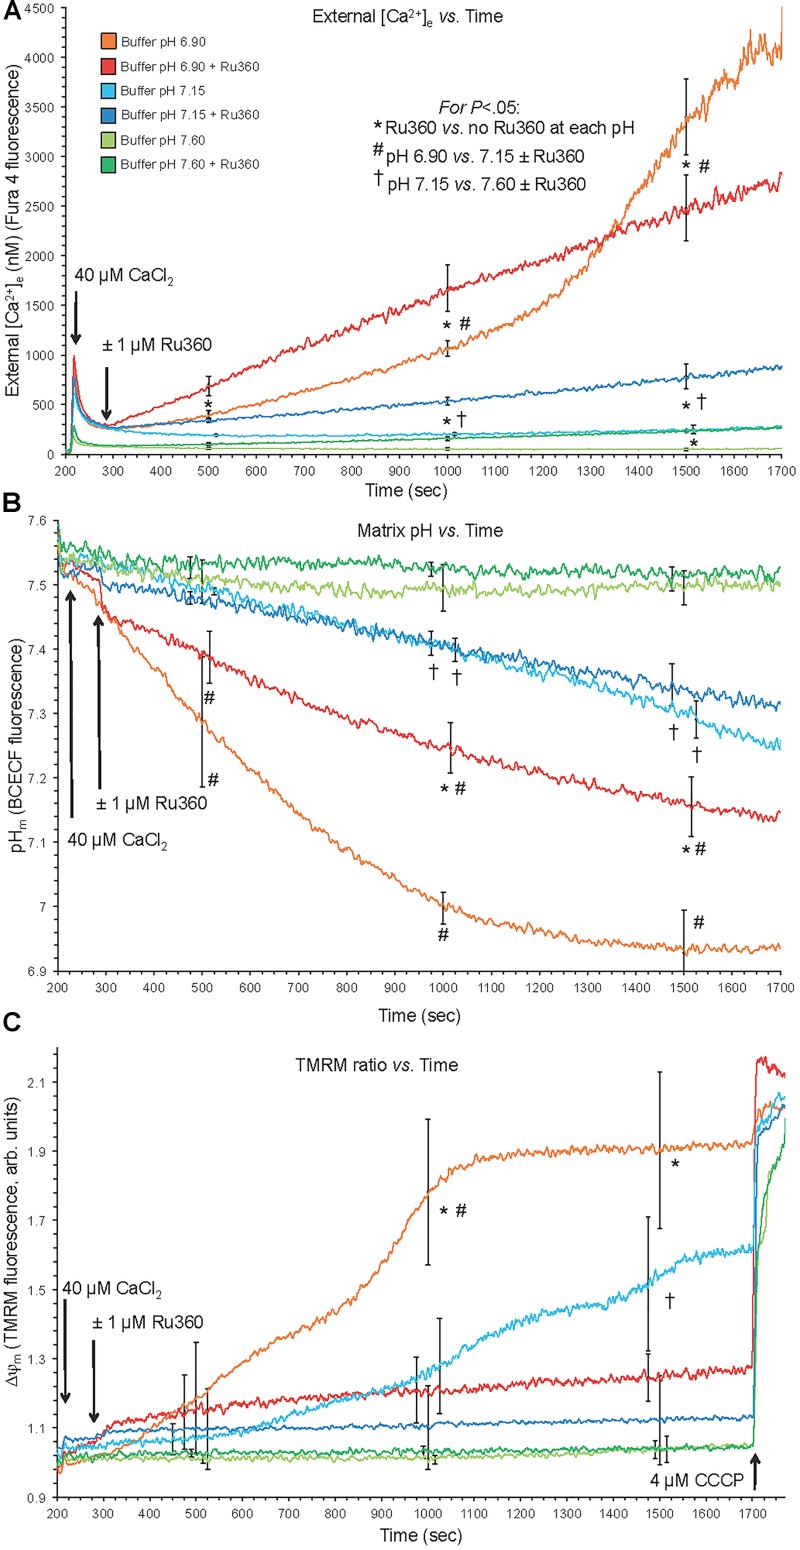
FIGURE 1.
Changes in buffer [Ca2+]e (A), matrix pHm (B), and ΔΨm (C) over time after adding 40 μM CaCl2 (210 s) at extra-mitochondrial pHe 7.6, 7.15, and 6.9 with or without 1 μM Ru360 (300 s) to inhibit additional mCa2+ uptake via MCU. Note the rapid fall in [Ca2+]e due to fast mCa2+ uptake via the MCU and the following slow rise in [Ca2+]e (Ca2+ efflux) (A), slow decline in pHm (B), and slow depolarization of ΔΨm (C) at pH 6.9 (each line = mean of 3–4 replicates from 12 guinea pig hearts for each fluorescence measurement). Note in the pH 6.9 medium the faster rate of mCa2+ efflux (A) over time when MCU was blocked, and the faster declines in pHm (B) and ΔΨm (C) over time when MCU was not blocked.

