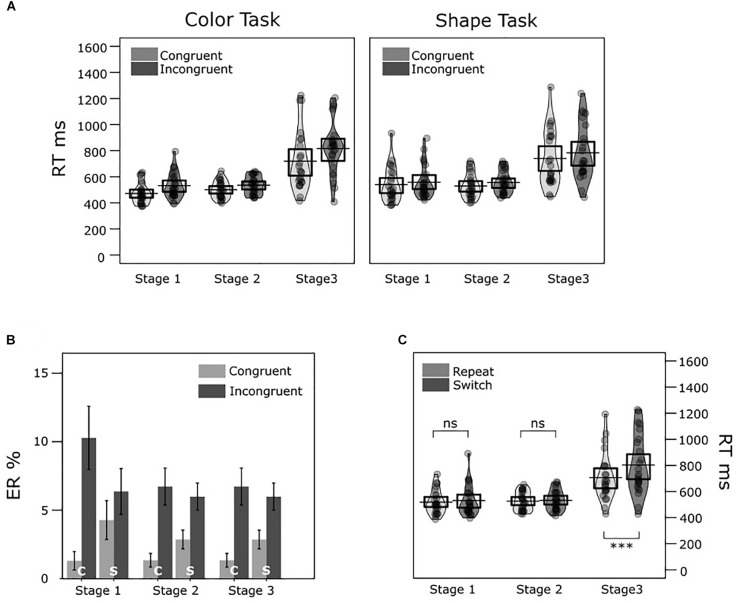
FIGURE 2.
Experiment 1 mean response times (RTs) and error rates (ERs) across conditions. (A) The two violin plots illustrate the RT distributions in congruent and incongruent conditions across stages in the color task and shape task, respectively. The jittered dots inside each bean represent averaged RTs of each participant. The black horizontal bar and the box around it represent the mean and the 95% CI of the mean in each condition, respectively. (B) Bar charts show mean ERs in each condition (c = color/ s = shape task with congruent/ incongruent targets in Stage 1, 2, and 3). The error bars denote ± 1 SEM. (C) Similar violin plots illustrate RT distributions for the repeat and switch conditions across stages. ns = non-significant, ∗∗∗p < 0.001.

