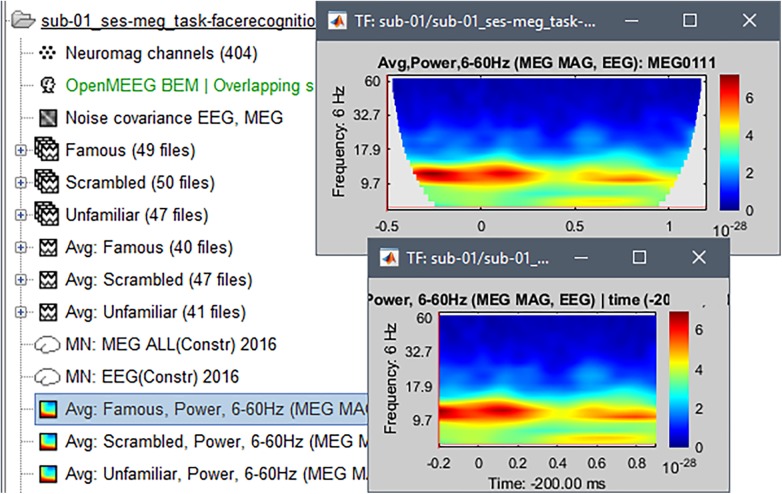
FIGURE 9.
Time-frequency decomposition (Morlet wavelets) for channel EEG070, averaged over trials from the “Familiar” condition. The figure shows the outcome of the decomposition before (top) and after (bottom) removing signal edge effects. The TF plots for the other two conditions (“unfamiliar,” scrambled”) were visually indistinguishable from the one shown.

