Figure 2.
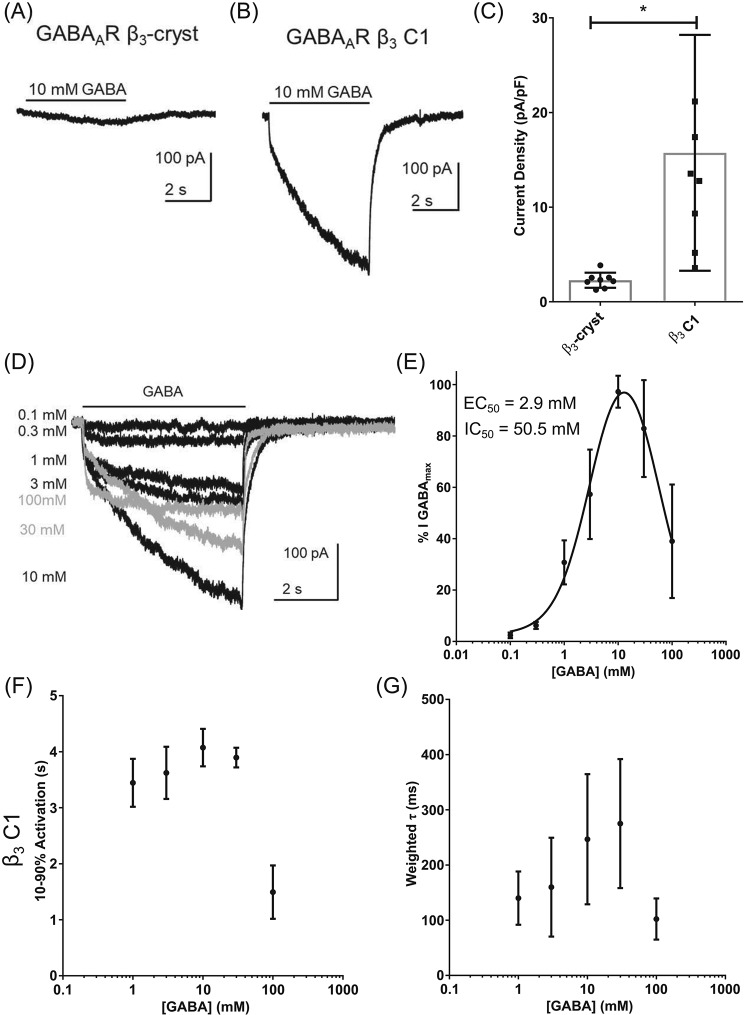
GABAAR β3 C1 is activated and inhibited by GABA. A and B, examples of currents recorded when GABA (10 mm) was applied to cells expressing GABAAR β3-cryst (A) and GABAAR β3 C1 (B) indicate that the latter is functional and activated by the neurotransmitter. C, mean ± S.D. current densities evoked by GABA (10 mm), with an asterisk indicating significant differences between the proteins (n = 7, p = 0.003, t test). D, examples of currents mediated by GABAAR β3 C1, evoked by increasing concentrations of GABA. Currents in gray are declining due to inhibition by GABA (>10 mm). The bar indicates GABA application (5 s). E, concentration-response relationships obtained using the percentage of the maximum amplitude recorded for each cell (n = 5). Logistic equations were fitted to the data points (see “Experimental procedures”). From the double-logistic fit, two distinct potencies were observed for activation (EC50 = 2.9 mm) and inhibition (IC50 = 50.5 mm). A summary of the data is in Table 2. F, graph of mean current 10–90% rise time. Activation rates are slowed somewhat by increasing the GABA concentration in β3 C1 (n = 6, F(4,25) = 42.2, one-way ANOVA post hoc Dunnett's, p = 0.04 comparing 10 with 1 mm GABA), whereas currents evoked by 100 mm GABA were activated faster (n = 6, p < 0.0001, F(4,25) = 42.2, one-way ANOVA post hoc Dunnett's, comparing 100 with 1 mm GABA). G, values for weighted τ of deactivation exhibited a similar trend with increasing GABA concentration (p = 0.04, one-way ANOVA, n = 6, F(4,19) = 3.2), although there was no significant difference comparing 1 mm with the other GABA concentrations tested. Detailed information about the components is in Table 3. Error bars represent S.D.

