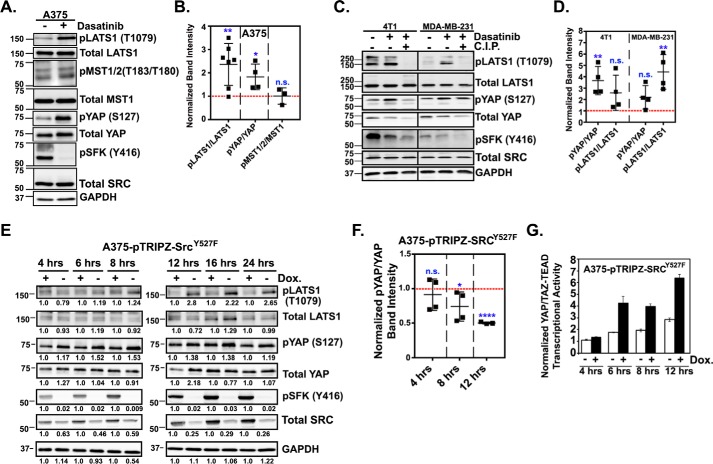
Figure 3.
SRC represses LATS activation and inhibitory phosphorylation of YAP and TAZ. A and C, representative experiments in which the indicated cells were treated with DMSO or dasatinib for 1 h and then assayed by Western blotting. Lysates from dasatinib-treated cells were treated with calf intestinal phosphatase (C.I.P) and run in parallel to ensure that the detected bands were phosphorylated proteins. B and D, band intensities for total and phosphorylated YAP, LATS1, and MST were quantified, normalized to GAPDH, and plotted as scatter plots showing mean ± S.D. (error bars). E and F, A375 cells stably expressing a doxycycline-inducible form of SRCY527F were treated with 0.5 μg/ml doxycycline for the indicated times and then assayed by Western blotting. E, one representative experiment with relative band intensities indicated. F, the average ratio of phosphorylated over total YAP, LATS, and MST for all experiments. G, cells from E were assayed for YAP/TAZ-TEAD transcriptional activity (n = 4 replicates from one experiment). In scatter plots, each dot is an independent experiment in which the dasatinib-treated cells (B and D) or doxycycline-treated cells (F) were converted to -fold change over control cells, which are indicated by the red dotted line. Statistical significance was tested using Student's t test. n.s. = p > 0.05; *, p ≤ 0.05; **, p ≤ 0.01; ****, p ≤ 0.0001.

