Figure 1.
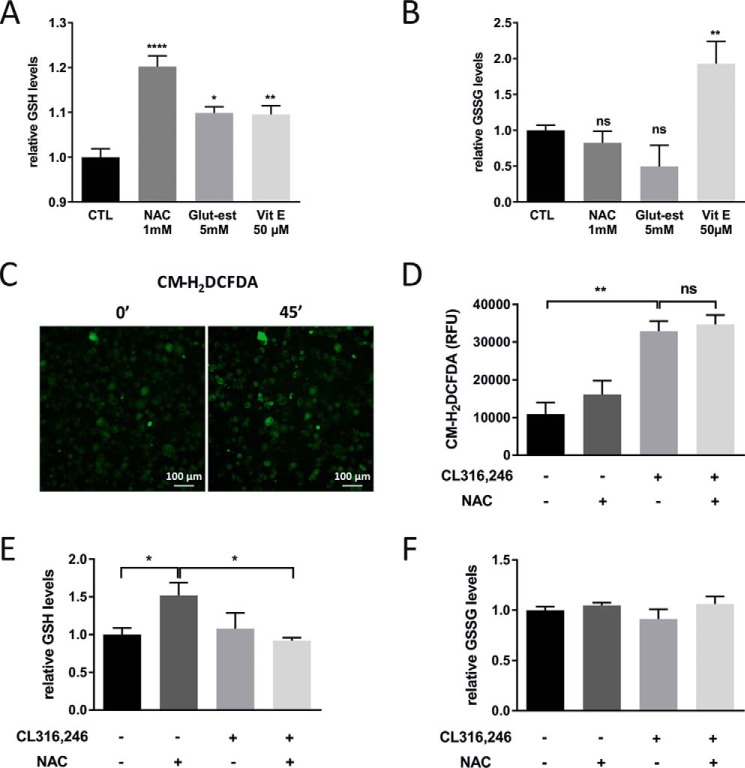
β3-AR stimulation increases ROS production, and NAC pretreatment has no effect on this response. A, relative GSH levels in cultured adipocytes treated with or without NAC, GSH ethyl ester (Glut-est), and vitamin E (Vit E) for 48 h (n = 4/group; *, p < 0.05; **, p < 0.01; ****, p < 0.0001). B, relative GSSG levels in cultured adipocytes treated with or without NAC, GSH ethyl ester, and vitamin E for 48 h (n = 4/group; **, p < 0.01). C, representative ROS emission images (CM-H2DCFDA) of cultured adipocytes after 45-min (45′) incubation with 5 μm CL316,246. D, quantification of the ROS emission of cultured adipocytes pretreated with or without 1 mm NAC for 24 h after 60-min incubation with 1 μm CL316,246 (n = 3/group; experiment repeated three times). E and F, relative GSH (E) and GSSG (F) levels in cultured adipocytes in the presence or absence of 1 mm NAC for 48 h exposed to 1 μm CL316,246 or vehicle for 24 h (n = 4/group; *, p < 0.05). Error bars represent S.E. ns, not significant; RFU, relative fluorescence units; CTL, control.

