Figure 4.
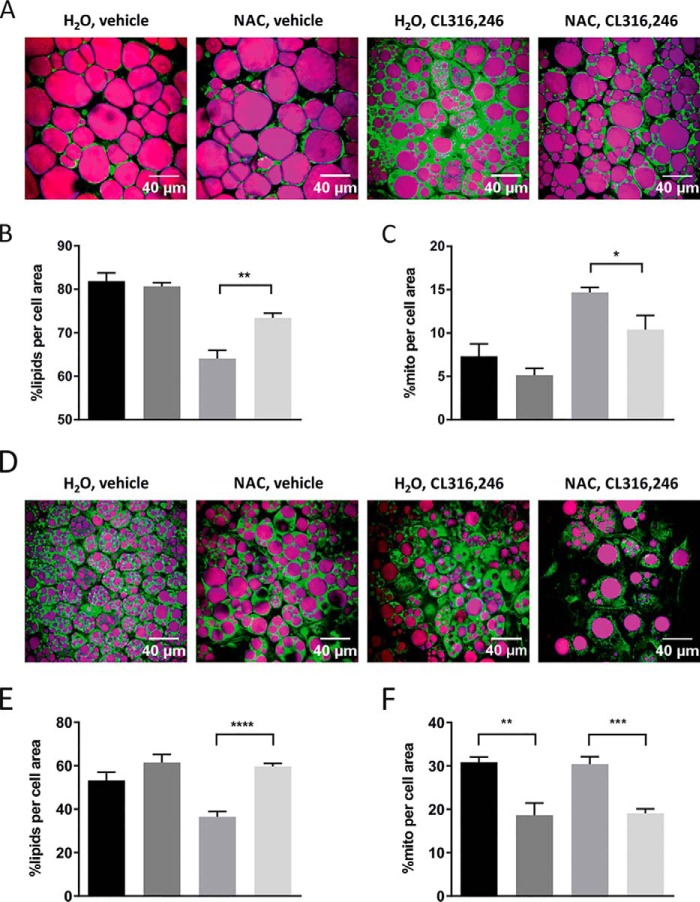
NAC pretreatment reduces mitochondrial activity in white and brown adipose tissue in response to β3-AR stimulation. A, representative images of fresh pieces of IWAT of C57/Bl6 mice pretreated for 1 week with either water or NAC (1 g/liter solution) followed by 10 days of injection with either vehicle or 1 μg of CL316,246/g of body weight as judged by CARS (lipids; in purple) and two-photon fluorescence microscopy (mitochondria; in green). B and C, quantification of lipid content (B) and mitochondrial density/activity (C) in experiments depicted in A (n = 5/group; *, p < 0.05; **, p < 0.01). D, representative images of fresh pieces of BAT of C57/Bl6 mice pretreated for 1 week with either water or NAC (1 g/liter solution) followed by 10 days of injection with either vehicle or 1 μg of CL316,246/g of body weight as judged by CARS (lipids; in purple) and two-photon fluorescence microscopy (mitochondria; in green). E and F, quantification of lipid content (E) and mitochondrial density/activity (F) in experiments shown in D (n = 5/group; **, p < 0.01; ***, p < 0.001; ****, p < 0.0001). Error bars represent S.E.

