Figure 1.
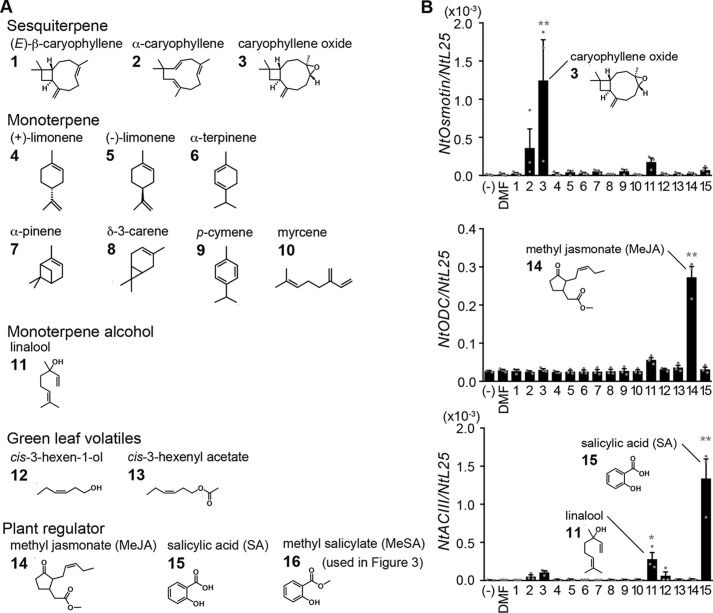
Gene expression profiles induced by various VOCs in BY-2 cells. A, chemical structures of VOCs and plant regulators used for structure–activity relationships in B and Fig. 3B. The VOCs were classified into five groups. Numbers placed at the top left-hand corner of each structure correspond to labels in B and Fig. 3B. B, structure–activity relationships of VOC-induced gene expression in BY-2 cells. BY-2 cells were exposed to DMF (0.1%), MeJA (0.1 mm), SA (0.1 mm), or other VOCs (1 mm; see A) for 3 h. Top, NtOsmotin; middle panel, NtODC (jasmonic acid-related gene); bottom, NtACIII (salicylic acid-related gene). Expression of each gene was normalized to NtL25. Error bars, S.E. (n = 3). Statistics were calculated using one-way ANOVA and Dunnett's post hoc test: *, p < 0.05; **, p < 0.01.

