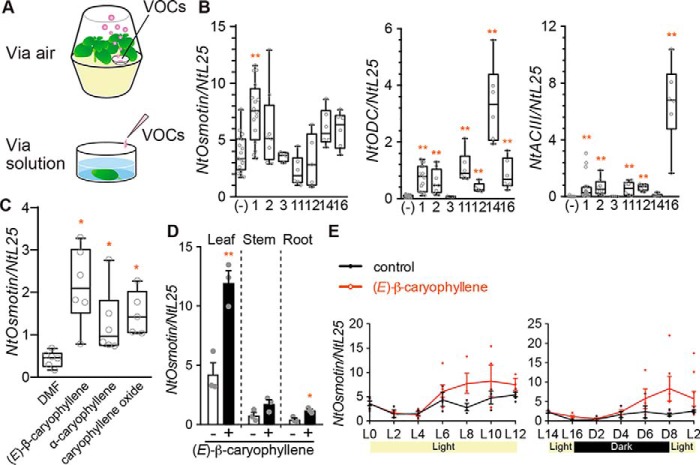
Figure 3.
Gene expression profiles induced by various VOCs in tobacco plants. A, experimental setup. Top, the method for B and Fig. 5F. Bottom, the method for C. B, structure–activity relationships of VOC-induced gene expression in tobacco plants. Plants were exposed to each compound (40 μl; see compound numbers in Fig. 1A) for 8 h. Left, NtOsmotin; middle, NtODC (jasmonic acid-related gene); right, NtACIII (salicylic acid–related gene). Expression of each gene was normalized to NtL25 (n = 4–17). Whiskers indicate 1.5 times the interquartile range. Statistics were calculated using the Kruskal–Wallis test and post hoc test (Steel test): *, p < 0.05; **, p < 0.01. C, NtOsmotin expression induced by immersing leaves in solutions of caryophyllene structural analogues (1 mm) or DMF (0.1%) for 8 h (n = 5–6). Whiskers indicate 1.5 times the interquartile range. Statistics were calculated using the Kruskal–Wallis test and post hoc test (Steel test): *, p < 0.05. D, NtOsmotin expression induced by (E)-β-caryophyllene in different organs. White bars, control group; black bars, experimental group. Error bars, S.E. (n = 3). Statistics were calculated using unpaired Student's t test: *, p < 0.05; **, p < 0.01. E, time course of NtOsmotin expression induced by (E)-β-caryophyllene under different light conditions. Left, from light phase 0-h time point (L0) to L12; right, L14–L2. Error bars, S.E. (n = 3–9).

