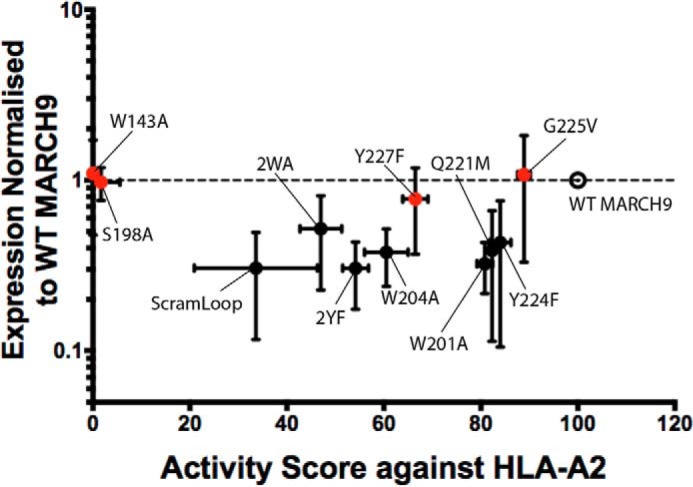
Figure 7.

Relationship between MARCH9 mutant activity and protein levels. Expression levels for the indicated mutants (y axis) were analyzed by transient transfection in 293T cells as shown in Figs. 2 and 3, and MARCH9-specific bands were quantitated by densitometry. MARCH9 expression was normalized to GAPDH signal and plotted relative to WT (open circle). Activity score (x axis) was determined by the reduction in surface levels of HLA-A2 after dox treatment (data shown in Figs. 2–5) and expressed as a percentage of WT activity. Dashed line represents expression of WT MARCH9, which was set to 1 for comparison. Vertical error bars represent S.D. of at least three independent transfections (n ≥ 3). Horizontal error bars represent S.E. of three independent experiments (n = 3). Red symbols highlight mutants for which functional defects are likely to be independent of total cellular protein levels.
