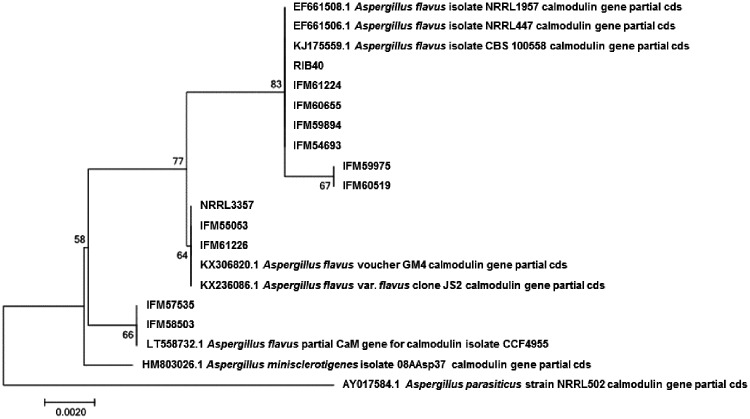
Figure 3.
Molecular phylogenic analysis of partial cmdA sequences by the maximum likelihood method based on the Kimura 2-parameter model.37 The tree with the highest log likelihood (−817.8602) is shown. The number at each of the branch points indicates percentage of association of the clustered sequences listed. Initial tree(s) for the heuristic search were obtained automatically by applying neighbour-joining and BioNJ algorithms to a matrix of pairwise distances estimated using the maximum composite likelihood approach and then selecting the topology with superior log likelihood value. A discrete γ distribution was used to model evolutionary rate differences among sites [5 categories (+G, parameter = 0.0500)]. The tree is drawn to scale, with branch lengths based on the number of substitutions per site. The analysis involved 20 nucleotide sequences. All positions containing gaps and missing data were eliminated. There were a total of 516 positions in the final data set. Evolutionary analysis was conducted as in MEGA7.17

