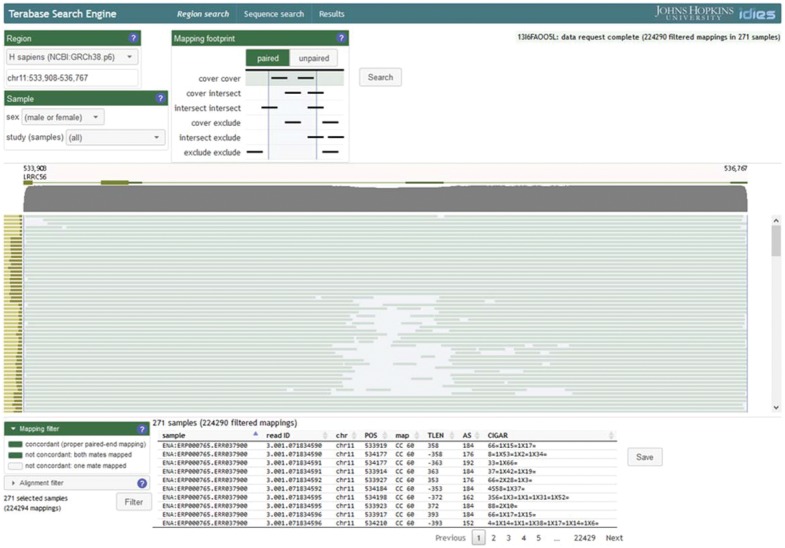
Fig. 2.
TSE web user interface. Search criteria (‘Region’, ‘Sample’, ‘Mapping footprint’) are specified prior to searching the database to visualize per-sample coverage. The result of such a search is a coverage map in which each horizontal bar represents coverage for one WGS sample. The vertical (left) histogram represents the total number of reads for each WGS sample. The horizontal (top) histogram indicates total coverage for each reference-genome location. Individual reads may be visualized and saved for subsequent processing by selecting specific WGS samples and by applying ‘mapping filter’ criteria

