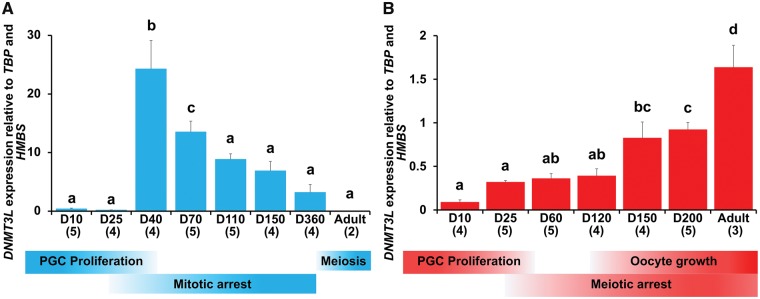
Figure 5.
Profiling of tammar DNMT3L expression during gametogenesis. Tammar DNMT3L expression in (A) Developing testes and (B) developing ovaries based on RT-qPCR of DNMT3L gene expression. Mean + SE are shown and the numbers in parentheses indicate the sample numbers at each developmental stage. Bars labelled with the same letters represent values that do not differ significantly by Tukey–Kramer’s multiple comparison test at P < 0.05. The corresponding developmental stages of male and female tammar germ cells are shown at the bottom.

