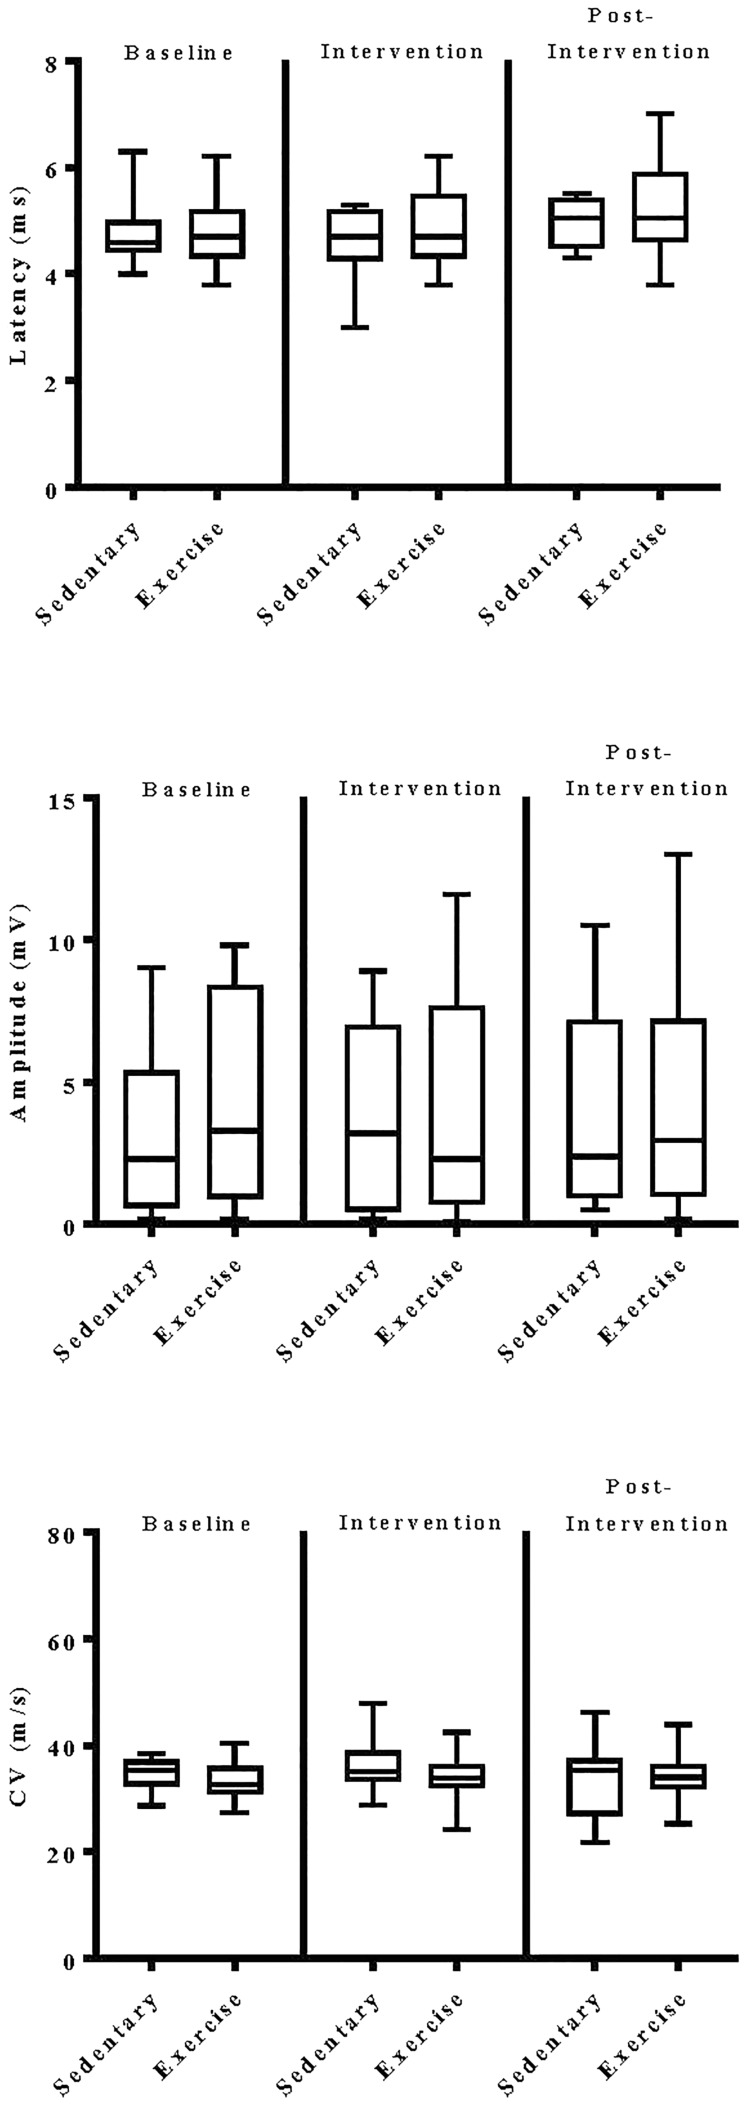
FIGURE 7.
Group analyses of the effect of exercise on tibial nerve evoked electrodiagnostic parameters. Data shown are the median, interquartile range, and minimum–maximum range of latency, amplitude, and calculated conduction velocity elicited from antidromic stimulation of tibial nerves at entry into the study (baseline), immediately following intervention, and again at 12-week post-intervention of responding patients, as indicated. Parametric data were analyzed by two-way ANOVA with Tukey’s multiple comparison post hoc analysis. The total number of patients with measurable responses at baseline (sedentary controls, N = 11; exercise, N = 31), immediately following intervention (sedentary controls, N = 9; exercise, N = 27), and at 12-week post-intervention (sedentary controls, N = 8; exercise, N = 26) were group analyzed. At all three time points evaluated, there was no significant differences observed within and across experimental groups.

