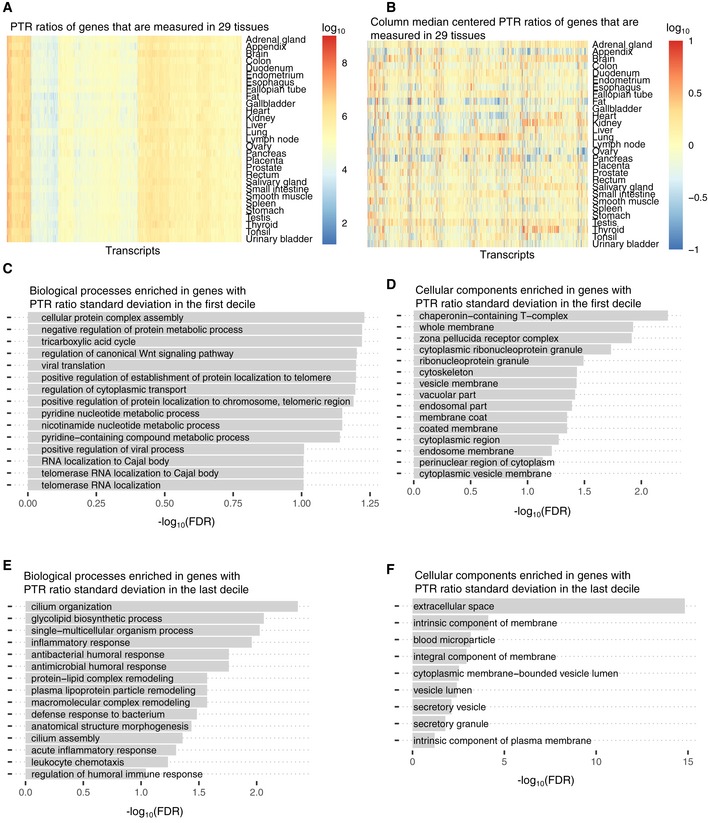
PTR ratios of the 4,506 genes that are measured at the transcriptome level and at the proteome level in 29 tissues.
PTR ratio fold‐change per gene across tissues. Values shown in (A) are centered per gene based on their median values across tissues.
Gene ontology terms (Biological Process) enriched for genes whose PTR standard deviation across tissues is in the first decile ((0.08,0.22] in log10) among 9,665 genes which are expressed in at least five tissues.
Gene ontology terms (Cellular Component) enriched for genes whose PTR standard deviation across tissues is in the first decile ((0.08,0.22] in log10) among 9,665 genes which are expressed in at least five tissues.
Gene ontology terms (Biological Process) enriched for genes whose PTR standard deviation across tissues is in the last decile ((0.7, 1.73] in log10) among 9,665 genes which are expressed in at least five tissues.
Gene ontology terms (Cellular Component) enriched for genes whose PTR standard deviation across tissues is in the last decile ((0.7, 1.73] in log10) among 9,665 genes which are expressed in at least five tissues.

