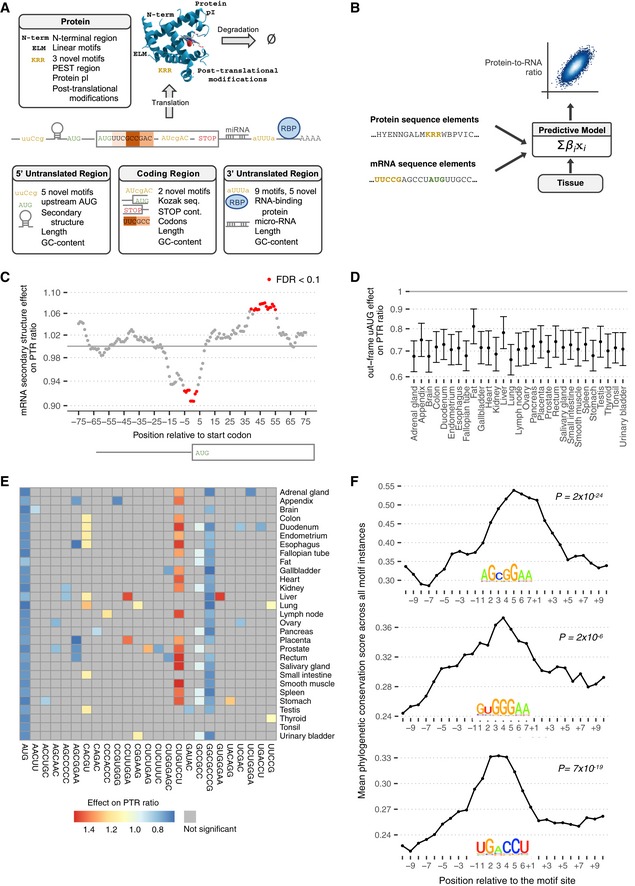
Figure 2. Predicting PTR ratios from sequence and 5′ UTR results.

- Sequence features of 5′ UTR, coding sequence, 3′ UTR, and protein sequence considered in the model.
- The predictive model is a multivariate linear model that predicts tissue‐specific PTR log‐ratios using tissue‐specific coefficients for the sequence features listed in (A).
- Effect of log2 negative minimum folding energy of 51‐nt window on median log10 PTR ratio across tissues corrected for all other sequence features listed in (A) (y‐axis, Materials and Methods) versus position of the window center relative to the first nucleotide of the canonical start codon (x‐axis) for genes with a 5′ UTR and a coding sequence longer than 100 nt. Statistically significant effects at P < 0.05 according to Student's t‐test and corrected by the Benjamini–Hochberg methods are marked in red.
- Effect estimate (dot) and 95% confidence interval (bar) of the presence of at least one out‐of‐frame AUG in 5′ UTR on log10 PTR ratio corrected for all other sequence features listed in (A) (y‐axis, Materials and Methods) per tissue (x‐axis).
- Estimated effect of PTR ratio in each tissue (row) of the 25 5′ UTR k‐mers (column) associating with either median PTR ratio across tissues or tissue‐specific gene‐centered PTR ratios. Color scale ranges from blue (negative effect) to red (positive effect). Gray marks non‐significant (FDR ≥ 0.1) associations.
- Average 100‐vertebrate PhastCons score (y‐axis, Materials and Methods) per position relative to the exact motif match instances in 5′ UTR (x‐axis) for three example k‐mers that are significantly predictive of PTR ratios in specific tissues. P‐values assess significance of the average 100‐vertebrate PhastCons scores at the motif sites compared to the two 10‐nucleotide flanking regions (Materials and Methods). The motif logos are constructed using all matches of the considered k‐mer up to one mismatch in the 5′ UTR sequences.
