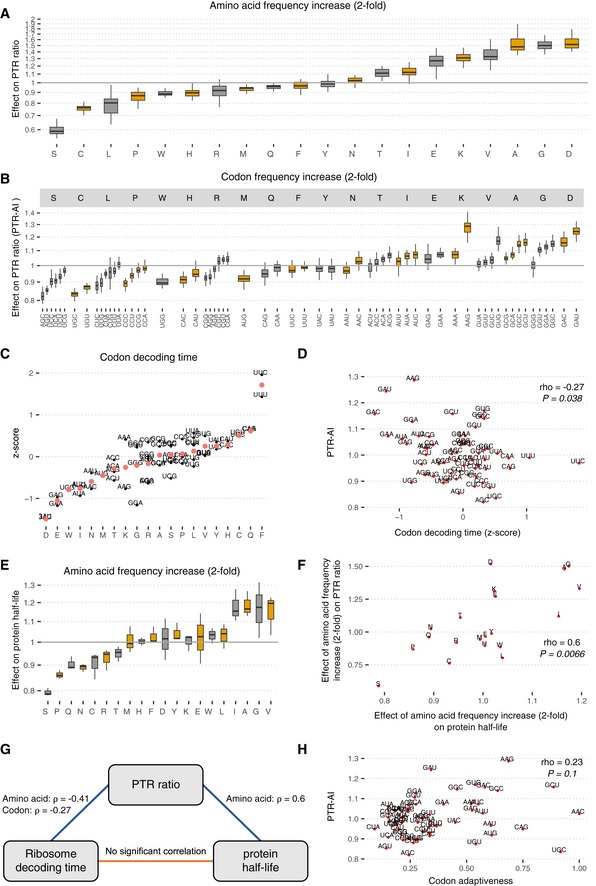
Figure 3. mRNA coding region sequence features results.

- Distribution of the amino effect on PTR ratio per tissue, which is the PTR ratio fold‐change associated with doubling the frequency of the amino acid (Materials and Methods). Shown are the quartiles (boxes and horizontal lines) and furthest data points still within 1.5 times the interquartile range of the lower and upper quartiles (whiskers).
- Same as (A) for codons (PTR‐AI). The codons are grouped by the amino acid they encode and are sorted first by increasing amino acid effect, then by increasing synonymous codon effect.
- Median codon decoding time (transformed to z‐scores) across 17 independent ribosome profiling datasets (y‐axis), grouped per amino acid (x‐axis). Red dots display the average amino acid decoding time (Materials and Methods). Amino acid types explain 70% of the variation in the decoding times of 61 codons.
- Median codon decoding time estimates (z‐scores) across 17 independent human Ribo‐Seq datasets (x‐axis) significantly negatively correlate with average PTR‐AI across tissues (y‐axis).
- Same as (A) for the distribution of the amino acid effect on protein half‐lives, which is the protein half‐life fold‐change associated with doubling the frequency of the amino acid, for five different cell types: HeLa cells (Zecha et al, 2018), B cells, NK cells, hepatocytes, and monocytes (Mathieson et al, 2018).
- Amino acid effect on protein half‐lives (x‐axis) significantly positively correlates with amino acid effect on PTR ratio (y‐axis).
- Correlation network of the amino acid or codon frequency when applicable on PTR ratio, codon decoding time, and protein half‐life. Significant Spearman correlations (P < 0.05) are found between the effects on PTR ratio and codon decoding time, and between the effects on PTR ratio and protein half‐life but not between codon decoding time and protein half‐life.
- Codon tRNA adaptiveness (x‐axis), a widely used codon optimality metric, does not significantly correlate with PTR‐AI (y‐axis), which may be a new optimality metric reflecting the combined effect of amino acid and synonymous codon usage on protein synthesis and degradation.
