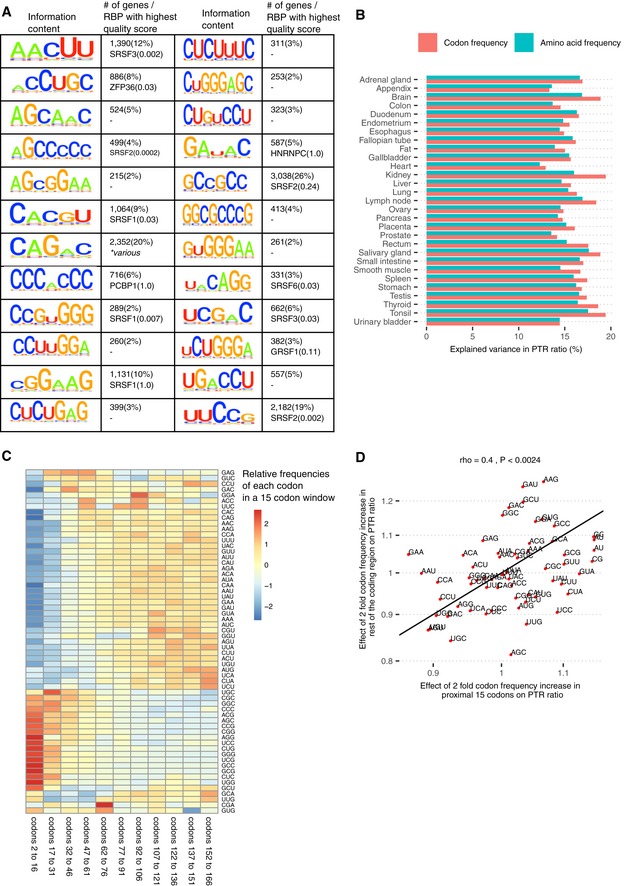
Figure EV3. 5' UTR k‐mers and positional effects of codon on PTR ratio.

- First and third columns: Motif information content logos for the 25 k‐mers of panel E in Fig 2 but AUG, obtained by motif consensus sequence search in 11,575 5′ UTR sequences allowing for one mismatch (Materials and Methods). Second and fourth columns: number and percentage of transcripts consensus motif sequence among the 11,575 transcripts (first line) and best significantly matching RNA binding protein motif of the database ATtRACT (Giudice et al, 2016) together with the ATtRACT motif quality score Q (value between 0 and 1, the higher the better; Materials and Methods).
- Log2‐transformed frequencies of 20 amino acids in the coding region explain on average 15% of the variance in tissue‐specific PTR ratios (min 12%, max 17%). In comparison, log2‐transformed frequencies of 61 codons, which inherently encode for amino acid frequency and synonymous codon usage, explain on average 16% of the variance in PTR ratios (min 13%, max 20%).
- Relative codon frequencies per bin of 15 codons (columns). Codon frequency is differentially distributed in the 5′ end of the CDS (from codon 2 to codon 31) compared to the rest of the coding region.
- In spite of the distinctive codon frequency composition of the coding region 5′ end as displayed in (C), twofold codon frequency increase effect in the proximal 15 codons significantly correlates with the twofold codon frequency increase effect in the rest of the coding region (Spearman's correlation = 0.4, P < 0.0024; Materials and Methods).
