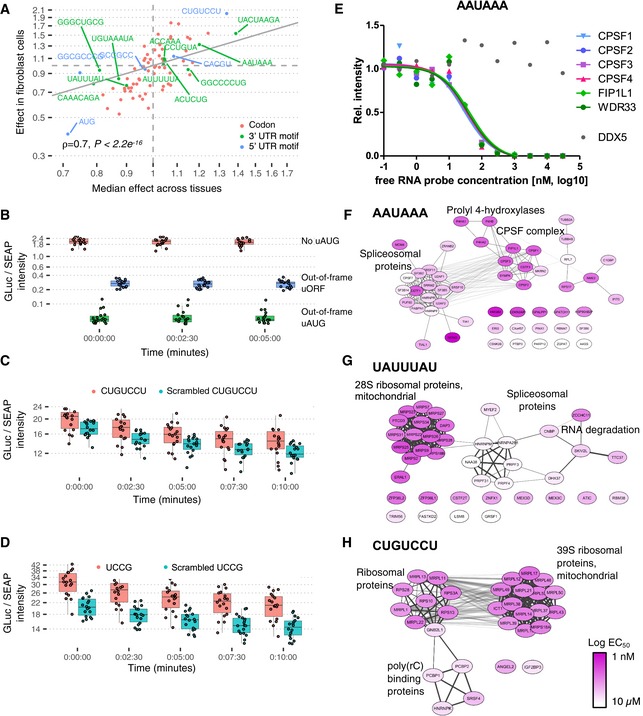
Figure 6. Independent validations.

-
AComparison of codon (red), 3′ UTR (green) and 5′ UTR (blue) motif median effects on PTR ratio across 29 human tissues (x‐axis) and effects on PTR ratios in an independent matched proteome and transcriptome dataset (Kremer et al, 2017). Because one does not expect effect of tissue‐specific motifs to necessarily reproduce in Fibroblasts, the plot is restricted to the motifs that show significant association with PTR ratio in at least five tissues.
-
BReporter assay of the AUG in 5′ UTR. Ratio of GLuc over SEAP intensities normalized per experiment (y‐axis, n = 18, Materials and Methods) per time point (x‐axis) and construct: no insertion (pink), inserted out‐of‐frame AUG (green), and inserted uORF, i.e., inserted AUG with an inserted stop codon in‐frame in the 5′ UTR (blue). Shown are the quartiles (boxes and horizontal lines) and furthest data points still within 1.5 times the interquartile range of the lower and upper quartiles (whiskers). Original GLuc over SEAP intensities for all tested motifs in Appendix Figs S15 and S16.
-
CAs in (B) for inserted 5′ UTR motif CUGUCCU (pink) or a scrambled version of it (blue, UUUGCCC).
-
DAs in (B) for inserted 5′ UTR motif UUCCG (pink) or a scrambled version of it (blue, CUUCG).
-
EProteome‐wide competition‐binding assay results for the polyadenylation signal motif AAUAAA and the cleavage and polyadenylation specificity factor (CPSF) complex.
-
F–HAAUAAA, UAUUUAU, and CUGUCCU motif‐specific RNA binding proteins (and their complex partners) and their interaction strength to the free RNA probe; node color: pEC50; physical and functional interactions of proteins derived from STRING.
