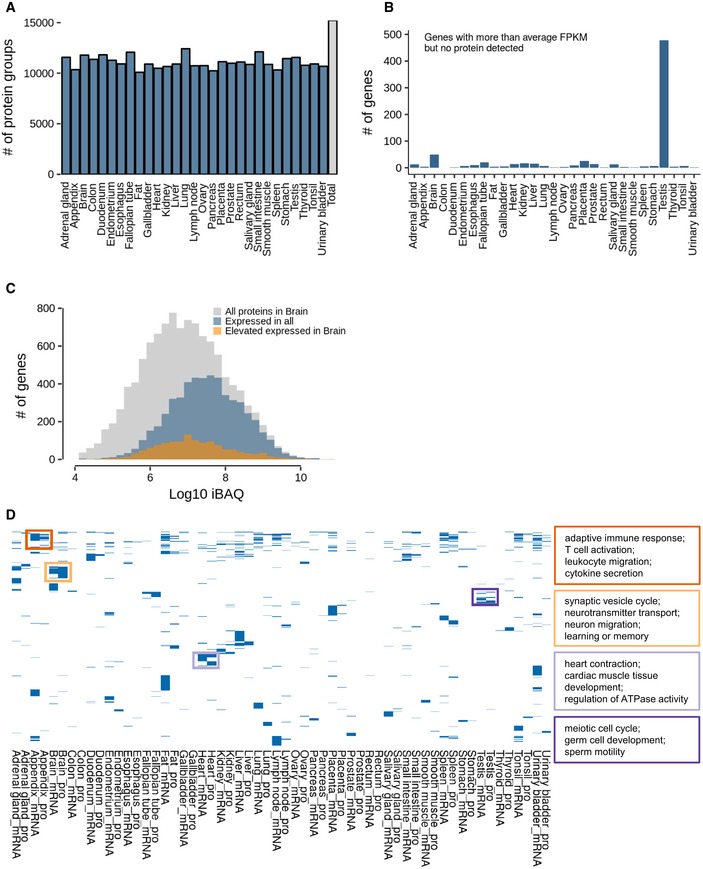
Figure EV1. Further characterization of human proteomes and transcriptomes.

- Number of identified protein groups for each of the 29 tissues.
- Number of genes in all tissues that were detected at the transcript with higher than average expression but not detected at the protein level. Note the very high number of such cases in testis.
- Abundance distribution of all proteins detected in human brain (grey). Proteins in blue are expressed in all 29 tissues, and proteins in orange show elevated expression in brain.
- Clustering of gene ontology terms (biological process) for proteins and transcripts that show the most divergent expression across all tissue. Boxes give examples of GO terms for four different tissues (Appendix, brain, heart and testis).
