
Figure 2. Analysis of protein and transcript expression levels within and across tissues.
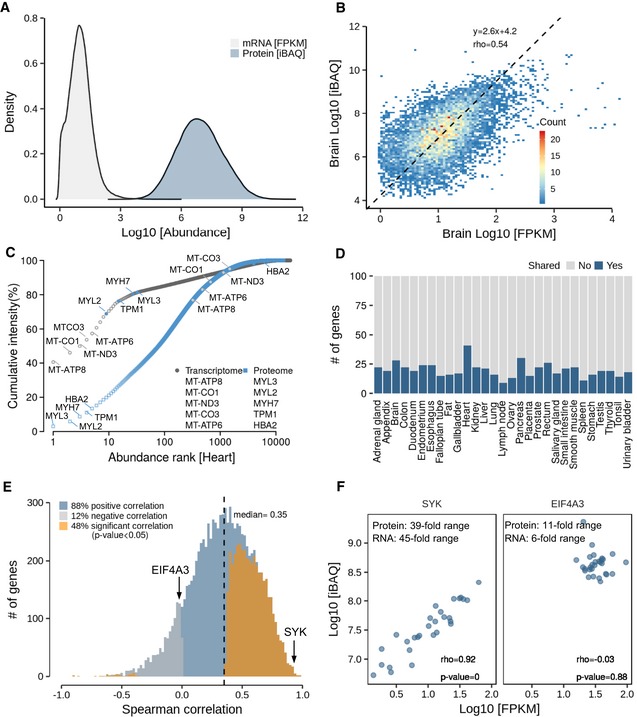
- Distribution of global transcript and protein abundance in all tissues. It is apparent that the dynamic range of protein expression (iBAQ scale) exceeds that of mRNA expression (FPKM scale; see Appendix Fig S10 for the corresponding plot for RNA and protein copy numbers).
- Protein‐to‐mRNA abundance plot for brain tissue. The slope of the regression line indicates that high‐abundance mRNAs give rise to more protein copies per mRNA than low‐abundance mRNAs.
- Ranked abundance plot of proteins and transcripts in human heart. While the 10 most abundant transcripts cover almost 70% of all transcripts in this tissue, the corresponding proteins only represent about 20% of the total protein.
- Analysis of the number of genes that are shared among the 100 most abundant transcripts and proteins. Regardless of the tissue, the fraction of shared genes rarely exceeds 20%.
- Correlation analysis of protein‐to‐RNA abundance (in log10 scale) across tissues, resulting in almost 90% positive correlations. The proteins highlighted in the next panel are marked.
- Examples for proteins that show high (SYK, left panel) or no (EIF4A3, right panel) correlation of protein/RNA ratios across tissues. While the former indicates that different tissues express different quantities of SYK, EIF4A3 expression appears to be similar in all tissues.