
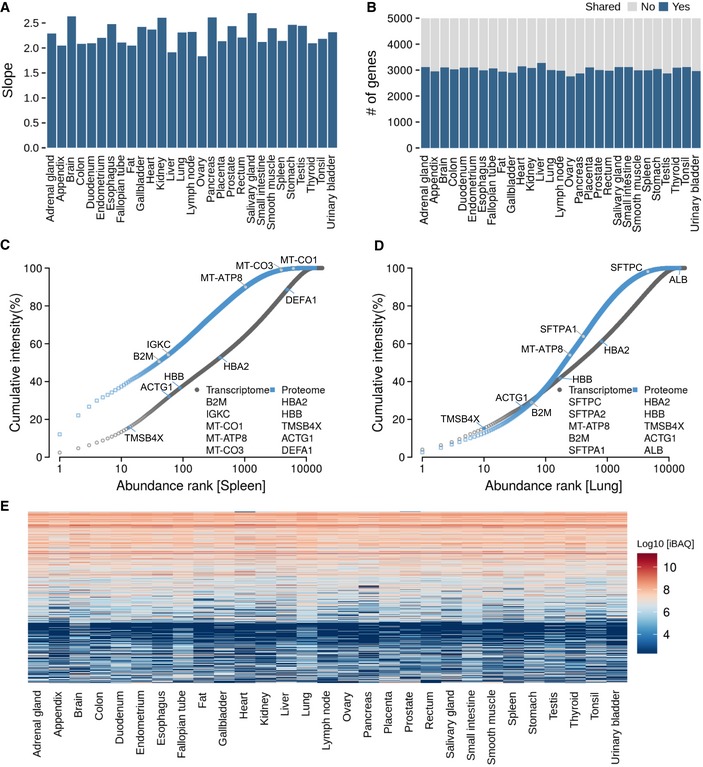
Figure EV2. Relationships between mRNA and protein expression.
-
ASlopes of the regression line in protein versus mRNA abundance plots (see main Fig 2B) for each tissue.
-
BNumber of genes that are shared among the 5,000 most abundant transcripts or proteins in each tissue.
-
C, DRanked abundance plots for transcripts and proteins in spleen and lung showing different characteristics in the abundance distributions (see also main Fig 2C and Appendix Fig S12 for all tissues).
-
EClustering of protein abundances across all tissues. It is apparent that many proteins have similar expression levels across several/many tissues.