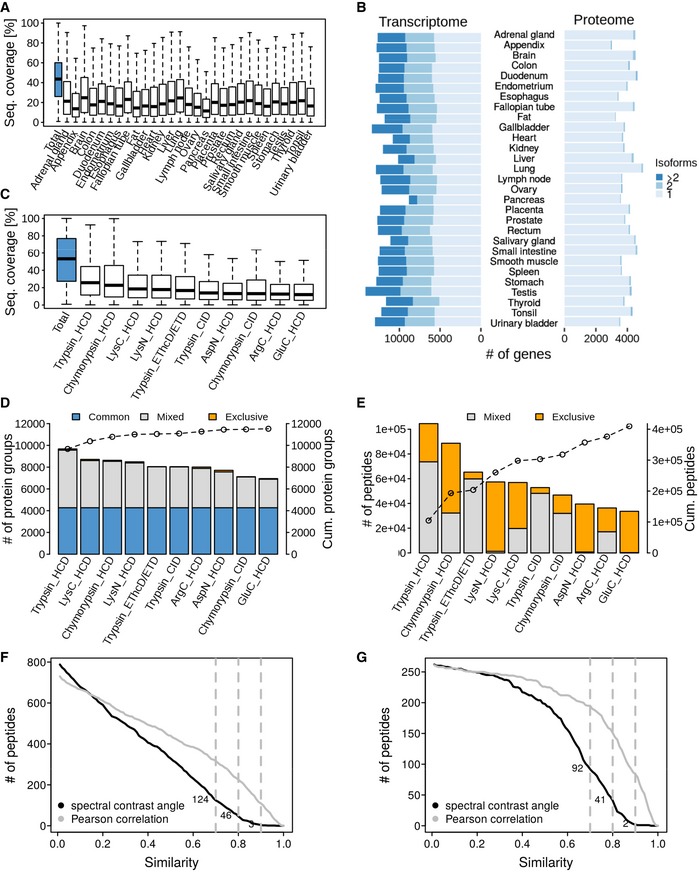
Distribution of peptide sequence coverage values obtained for proteins by mass spectrometry in each tissue. Horizontal lines: median. Box limits: 50% quantiles. Whiskers: all data points outside the box.
Analysis of the number of isoforms detected by transcriptomics or proteomics in each tissue.
Distribution of peptide sequence coverage obtained for proteins by mass spectrometry in tonsil tissue broken down by protease and fragmentation method used. Horizontal lines: median. Box limits: 50% quantiles. Whiskers: all data points outside the box.
Number of identified proteins in tonsil broken down by protease and fragmentation method used. Proteins covered by all workflows are marked in blue. Proteins identified by two or more workflows are indicated in grey and proteins exclusively identified by a single workflow in orange. The line connecting open circles indicates the cumulative number of proteins when adding data from the individual workflows.
Same as panel (D) but for peptides. Peptides covered by more than one workflow are marked in grey, and those exclusive for one workflow are marked in orange.
Number of experimental versus synthetic peptide reference spectra comparisons for candidate aTIS peptides (only the spectra with the highest spectral angle of each peptide were plotted) after database searching using Mascot as a function of the spectral angle or Pearson correlation coefficient. Dotted grey lines mark spectral angles of 0.7, 0.8 and 0.9.
Same as panel (F) but showing only candidate peptides that were identified by both Mascot and Andromeda.