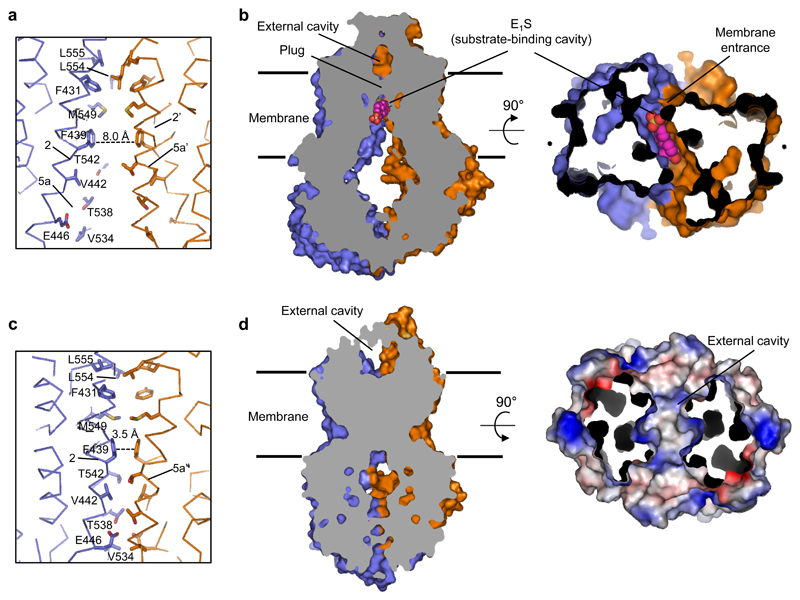
Figure 4. Substrate translocation pathway.
a, Cα-trace of the translocation pathway region of ABCG2EQ-E1S. Residues lining the substrate-binding cavity are shown as sticks, bound E1S has been omitted for clarity. The dashed line shows the distance between the two F439 residues that stack against bound E1S. b, Vertical slice through a surface representation of ABCG2EQ-E1S, with bound E1S shown as pink spheres and the two cavities and plug region labeled. On the right panel, 90° rotation of the structure revealing the fit of E1S in the substrate-binding cavity, as viewed from the cytoplasm. The NBDs have been removed for clarity. c,d Similar to a,b but of the ABCG2EQ-ATP structure. On the right panel of d, the molecular surface of the external cavity, viewed from the extracellular space and colour-coded by electrostatic potential ranging from blue (most positive) to red (most negative), is shown with EL3 removed for clarity.

