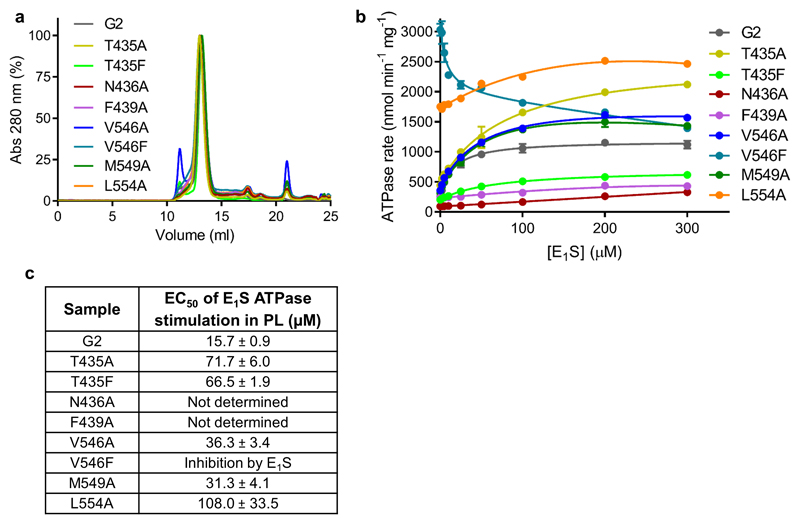
Extended data figure 5. Purification and functional analysis of mutants.
a, Analytical SEC profiles of the detergent-purified wild-type and substrate-binding cavity mutants used to make proteoliposomes for functional assays. b, ATPase rates of the liposome-reconstituted wild-type and mutant proteins in the presence of 0 – 300 µM E1S. Each point represents the mean rate derived from technical replicates (same batch of liposomes) and error bars show the standard deviation. For ‘G2’ n=6 apart from 0 and 200 µM E1S where n=9. For the mutants n=3. c, Table showing the EC50 of E1S ATPase stimulation determined after the data in b were normalized. The EC50 of E1S ATPase stimulation determined after normalizing the curves in b with the error of the fit (standard deviation) shown.

