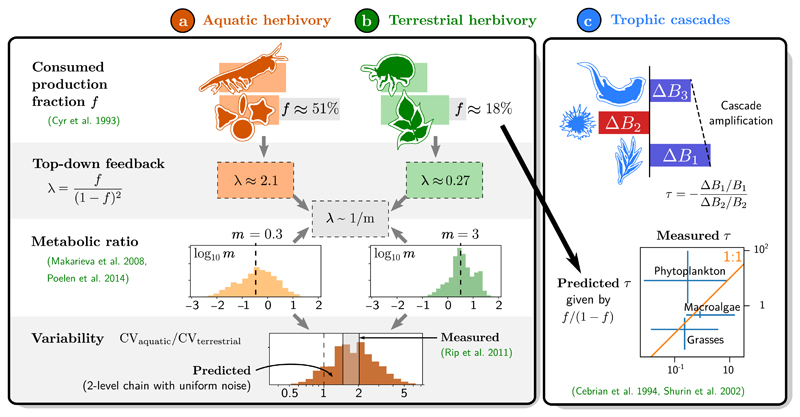
Figure 5.
Empirical functioning and stability patterns, and their relationships predicted by the synthetic model. (a) Aquatic herbivory accounts on average for f = 51% primary production removal across various ecosystems, while (b) terrestrial herbivory only removes f = 18% of production (Cyr & Pace 1993). They also differ by their median metabolic ratio m, measured from compiled data in Fig. S3 (Makarieva et al. 2008; Poelen et al. 2014). The corresponding values of λ are compatible with the scaling λ ~ 1/m predicted by resource-driven consumption (Box 2). We then study stability properties (Box 3) using a two-level chain model with uniform noise. Parameterising this model with m for each pair of species in the data set, we obtain a distribution of CV for each ecosystem. We find that aquatic herbivores are less stable (higher CV) than terrestrial ones, in agreement with empirical data (Rip & McCann 2011). (c) Empirical measurements of the trophic cascade amplification factor τ in tritrophic chains (Shurin et al. 2002), compared to predictions from data on removed production f for the basal level (Cebrian & Duarte 1994). Measurements are grouped by the nature of the primary producer (bars are 25th to 75th percentiles), with phytoplankton-based chains exhibiting weaker cascades than expected from their large consumed fraction f. Despite considerable variance, we find indicative evidence of consistency between these various patterns.

