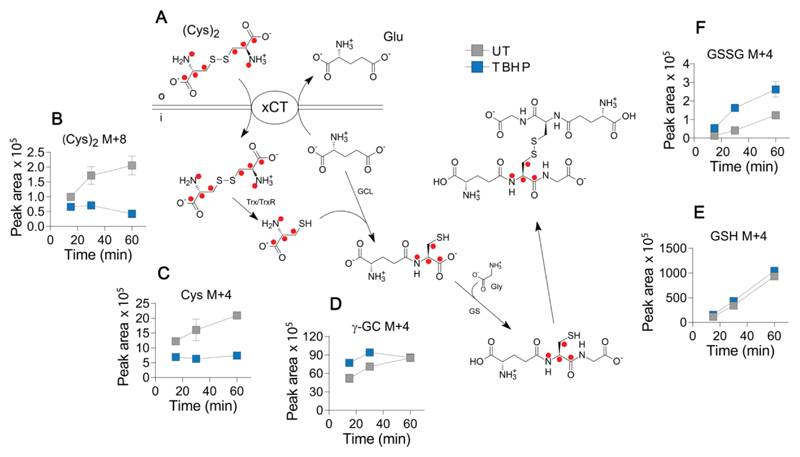
Figure 4. Oxidative stress decreases intracellular cystine via stimulation of GSH biosynthesis.
(A) Cells were fed with [U-13C6, U-15N2]cystine (200 μM) and the fate of the isotopic label within the GSH biosynthetic pathway was followed in cell lysates using LC-MS. Red dots indicate the position of carbon-13/nitogen-15 label. (B-F) Intracellular levels of labelled metabolites in lysates from untreated cells and cells treated with TBHP (200 μM, 1 h). (B) cystine [(Cys)2, M+8 molecular species]; (C) cysteine (Cys, M+4); (D) γ-glutamylcysteine (γ-GC, M+4); (E) reduced GSH (M+4); and (F) oxidized GSH (GSSG, M+4). Data are presented as mean ± SD of three replicate wells. Trx, thioredoxin; TrxR1, thioredoxin reductase 1; GCL, glutamate-cysteine ligase; GS, glutathione synthetase; Gly, glycine. o and i represent extracellular and intracellular compartments, respectively.

