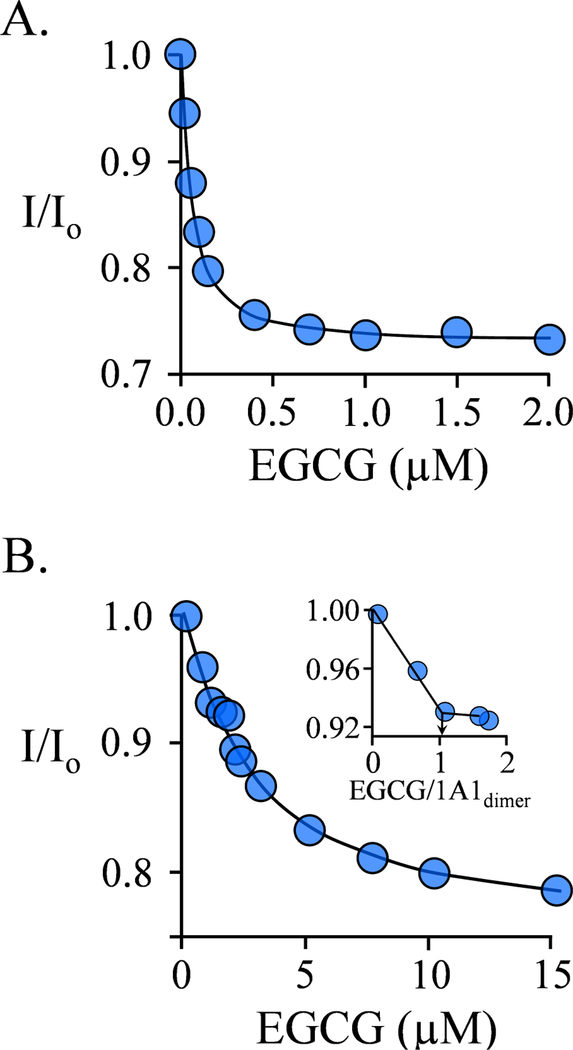
Figure 2. EGCG Binding to SULT1A1PAP Complex.
A.) EGCG Binding to the Nucleotide- bound Subunit. Binding was monitored via changes in the intrinsic fluorescence of SULT1A1 (λex = 290 nm, λgm = 370 nm). Fluorescence intensity is given relative to that in the absence of EGCG (I/I0). Conditions: SULT1A1 (75 nM, dimer), PAP (4.0 μM, 11 ▪ Kd PAP high affinity site and 0.10 ▪ Kd PAP low affinity site), MgCl2 (5.0 mM), NaPO4 (50 mM), pH 7.5, 25 ± 2°C. B.) Binding is Biphasic. Fluorescence was measured and plotted as describe in Panel A. Conditions: SULT1A1 (1.0 μM, dimer), PAP (4.0 μM, 11 ▪ Kd PAP high affinity site, 0.10 ▪ Kd PAP low affinity site), MgCl2 (5.0 mM), NaPO4 (50 mM), pH 7.5, 25 ± 2°C. The Panel B inset reveals the stoichiometry of EGCG binding at the PAP-containing subunit. The titrations were corrected for EGCG inner filter effects (see, Materials and Methods). Each data point is the average of three independent measurements, and the curved lines are the behaviors predicted by a best-fit, singlesite binding model.

