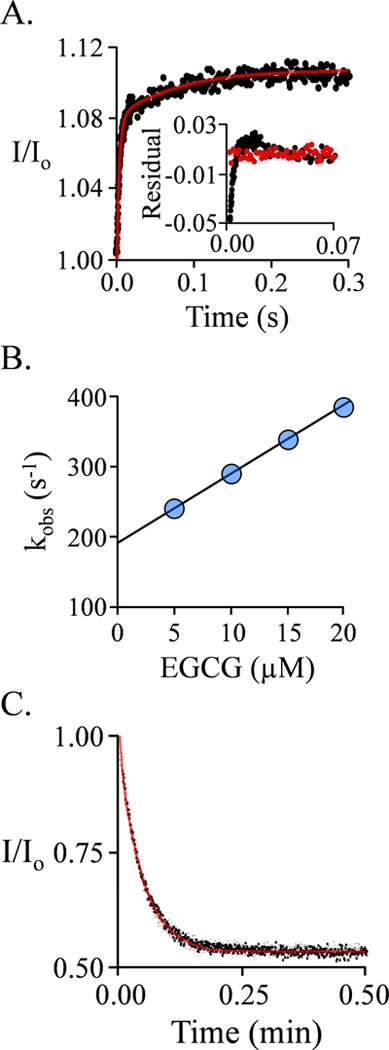
Figure 3. EGCG binding to the E·(PAP)2 Complex.
A.) The Binding-Reaction Progress Curve. Binding-induced fluorescence changes were monitored using a stopped-flow fluorimeter (λex = 290 nm, λem ≥ 325 nm (cutoff filter). Reactions were initiated by rapidly mixing (1:1 v/v) a solution containing SULT1A1 (0.25μM, active sites), PAP (0.50 mM), MgCl2 (5.0 mM), NaPO4 (50 mM), pH 7.5, 25 ± 2°C with a solution that was identical except that it lacked SULT1A1 and contained EGCG. The curve through the data (red line) is the behavior predicted by the best fit to a double-exponential model. The insert shows the residuals from a single- (black) and doubleexponential (red) fit. The single-exponential model deviates substantially from the data, while the bi-phasic model provides an excellent fit. B.) kobs vs [EGCG] for the First (Fast) Phase. kobs values were obtained at the four indicated EGCG concentrations under the conditions given in Panel A. Each value is the average of three independent determinations. The reactions were pseudo-first-order in EGCG in all cases. C.) EGCG Dissociation from E·(PAP)2·(EGCG)2 Complex. A pulse solution containing SULT1A1 (20 μM, monomer), EGCG (24 μM (4.0 μM free, 100 × Kd)), and PAP (500 μM, 16 ▪ Kd low affinity site), MgCl2 (5.0 mM), NaPO4 (50 mM), pH 7.5, 25 ± 2°C, was diluted 200:1 into a chase solution containing 75 μM 4-hydroxytamoxifen (TAM, 100 ▪ Kd cap open form), PAP (0.50 mM, 16 ▪ Kd low affinity site), NaPO4 (50 mM), MgCl2 (5.0 mM), pH 7.5, 25 ± 2°C. The final EGCG concentration is 0.12 μM (0.20 ▪ Kd cap open form). Dissociation was monitored by a change in SULT1A1 fluorescence (λex = 290 nm, λem = 370 nm). Three progress curves (black dots) are superposed. The curve through the data is the behavior predicted by a best-fit, single-exponential model.

