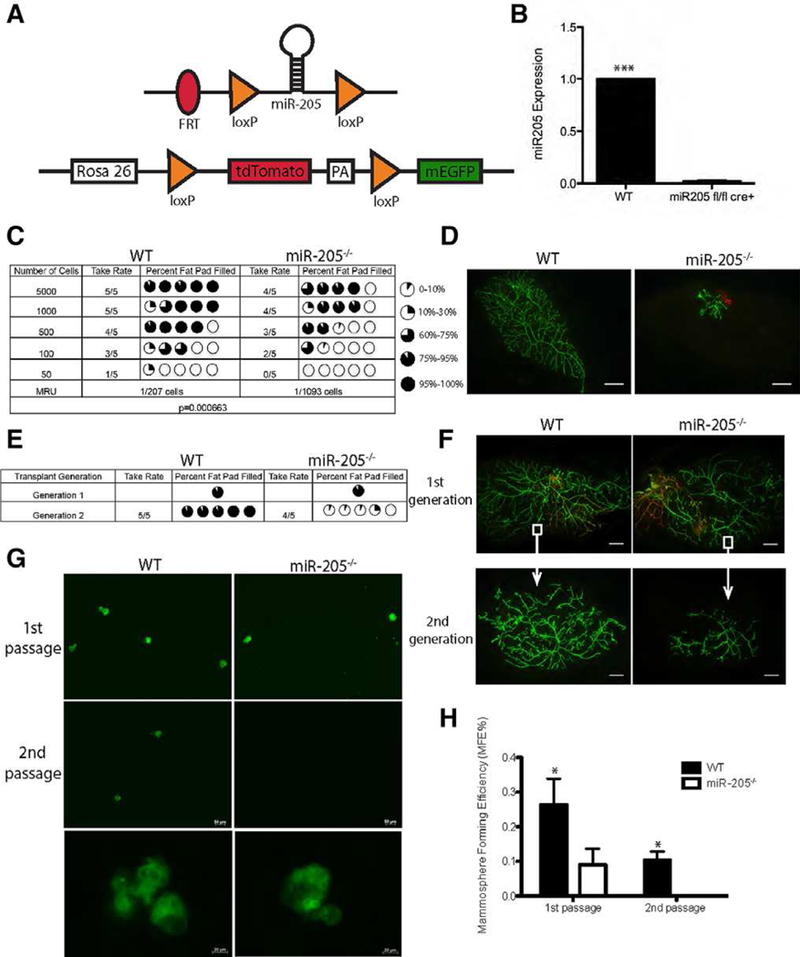
Figure 2.

Conditional depletion of miR-205 compromises stem-cell self-renewal. (A): Structure of mTmG double fluorescent reporter and targeted miR-205 locus following the deletion of the LacZ fragment using the Flp recombinase. (B): Quantitative polymerase chain reaction (qPCR) confirms the deletion of miR-205 in green mammary epithelial cells (MECs) sorted from miR-205fl/fl;RosamTmG/mTmG cre+ mice. (C): MECs from WT and miR-205−/− mice were serially diluted and injected contralaterally at doses shown in the table. The mammary repopulating units (MRUs) were calculated based on the take rate and the percentage of fat pad filled using ELDA (extreme limiting dilution analysis) software. Note that the MRU of WT is significantly higher than that of the miR-205−/− MECs (p = .00066). (D): Representative fluorescent whole-mount images of primary outgrowths generated from transplantation of 500 WT and miR-205−/− MECs. (E): Pieces of distal tissue (white squares in panel F) from the primary WT and miR-205−/− outgrowths generated from transplantation of 100,000 cells were retransplanted contralaterally into the cleared mammary fat pads of SCID-Beige mice to generate secondary outgrowths. Summary of the outgrowths observed in WT and miR-205 null transplants are shown in the table. (F): Representative images of primary and secondary outgrowths in WT and miR-205 null transplants. (G): Representative images of primary and secondary mammo-spheres generated from WT and miR-205−/− FACS-purified recombined green MECs. Note that the size of WT and miR-205−/− mammo-spheres are similar. (H): Plot of mammosphere forming efficiency (MFE) calculated for WT and miR-205−/− MECs. MFE is defined as the number of mammosphere formed divided by the number of total cells plated. Note that the MFE% of WT mammosphere is significantly higher than that of the miR-205−/− mammosphere in both the primary and secondary mammospheres. Data shown in (B) are mean ± SD from three independent experiments. Data shown in (H) are mean ± SD from three technical replicates (source green cells are isolated from five pairs of WT and miR-205 null outgrowths). Independent biological replicates not shown here using mixed population of red and green MECs also show similar results. *p < .05; **p < .01; ***p < .001 by unpaired Student’s t tests. Scale bars: (d) and (F) 20 um; (G) 50 um.
