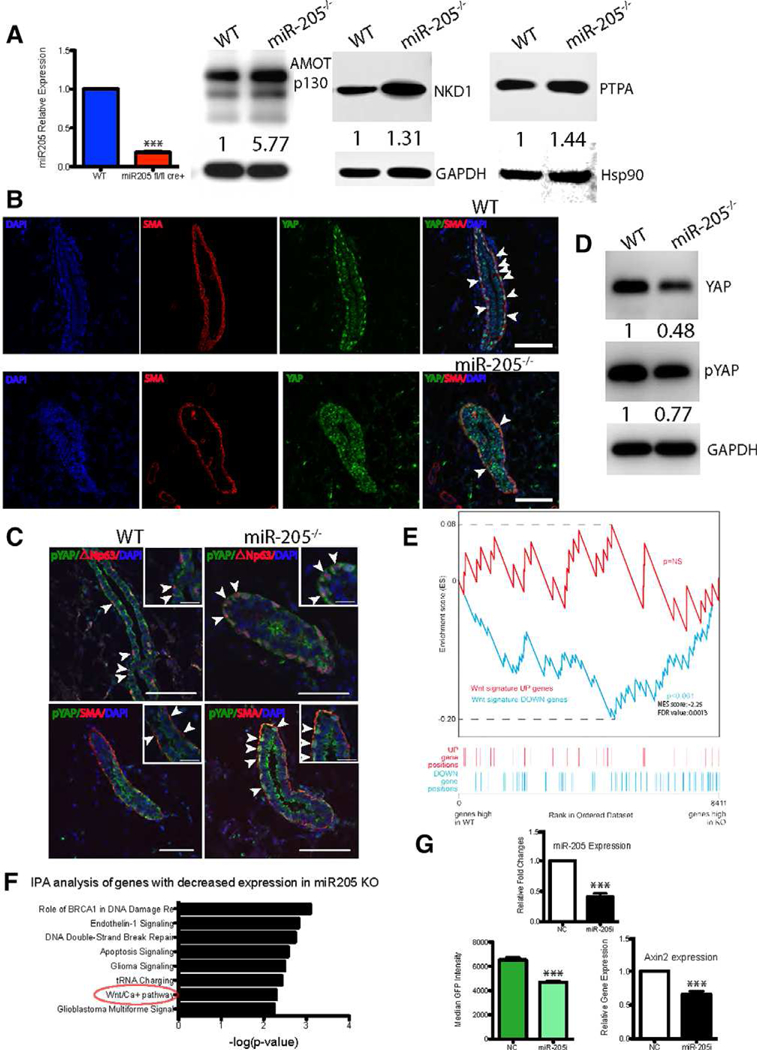
Figure 5.

YAP and Wnt signaling alteration upon miR-205 deletion. (A): Left panel: Quantitative polymerase chain reaction (qPCR) showing there is ~80% reduction in miR-205 expression in 72 hour cultured and sorted Ad-Cre treated green miR-205−/− MECs. Right panel: Western blot analysis on the cultured MECs displaying increased AMOT, NKD1, PTPA expression in the miR-205−/− group. Note that the AMOT antibody used recognizes two AMOT isoforms. The labeled band is AM0Tp130, and the lowest band is AM0Tp80, which shows a similar extent of reduction. (B): IF for YAP and αSMA depicting loss of nuclear YAP in αSMA+ basal cells in miR205−/− outgrowths. Arrowheads show strong nuclear YAP expression in SMA+ basal cells in WT outgrowth. (C): IF for pYAP shows that the majority of pYAP expression was seen in the luminal cells in the WT outgrowth. However, pYAP expression was observed in the cytoplasm of △Np63+/αSMA+ basal cells in miR205−/− outgrowths. Scale bars are 50 um. (D): Western blot analysis on the cultured MECs displaying decreased YAP and pYAP expression in the miR205−/− group. (E): Gene set enrichment analysis showing that Wnt-down (Wnt pathway-repressed genes) signature was significantly enriched in the genes highly expressed in the miR-205 null group, but low in the WT group. (F): IPA analysis on the downregulated genes in miR-205 null outgrowths showing enrichment of Wnt/Ca2+ pathway. (G): miR-205 expression, median GFP fluorescence intensity generated from 7TGC Wnt reporter, and Axin2 expression were significantly decreased in the miR-205 inhibitor treated group compared to negative control in HC11 cells. Data shown in qPCR are mean ± SD from three biological replicates. ***p < .001 by unpaired Student’s t tests.
