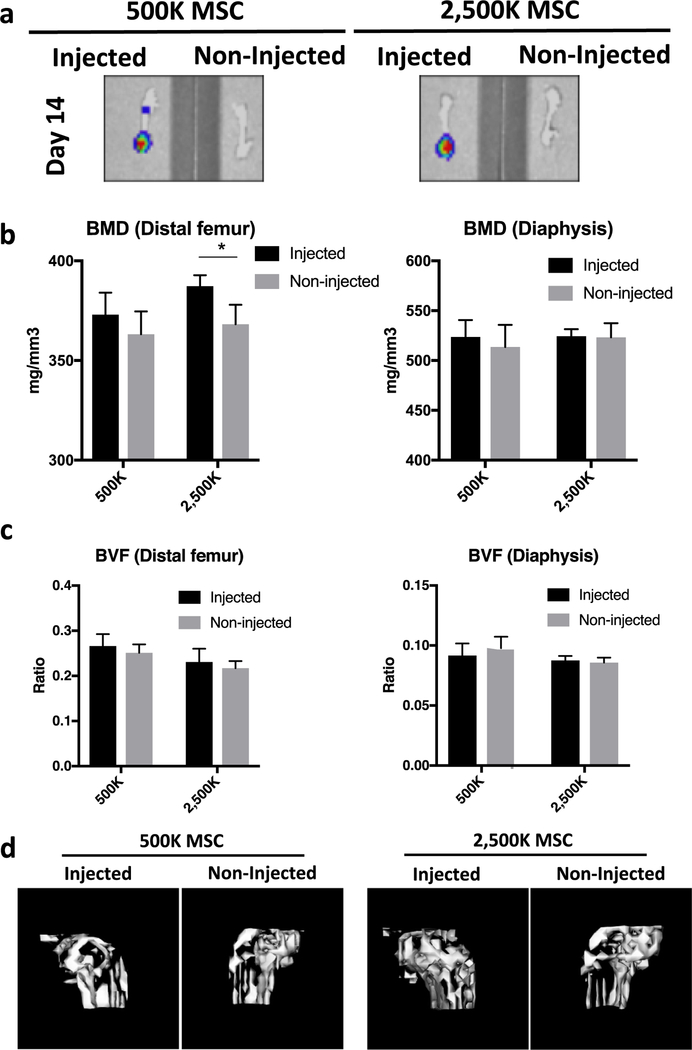
Figure 2.
Evaluation of the effects of injected MSCs on bone homeostasis using μCT. (a) Localization of injected luciferase reporter MSCs (500,000 or 2,500,000 cells per injection) examined using IVIS at day 14. (b and c) Quantification results of BMD (b) and BVF (c) in the femurs at the epiphysis (distal end) and diaphysis (700 HU) at day 28. (c) 3D reconstructed images at the distal end of femurs at day 28 (ROI = 2 × 4 × 3 mm3/1000 HU). *P < 0.05. HU= Hounsfield Unit (scale).

