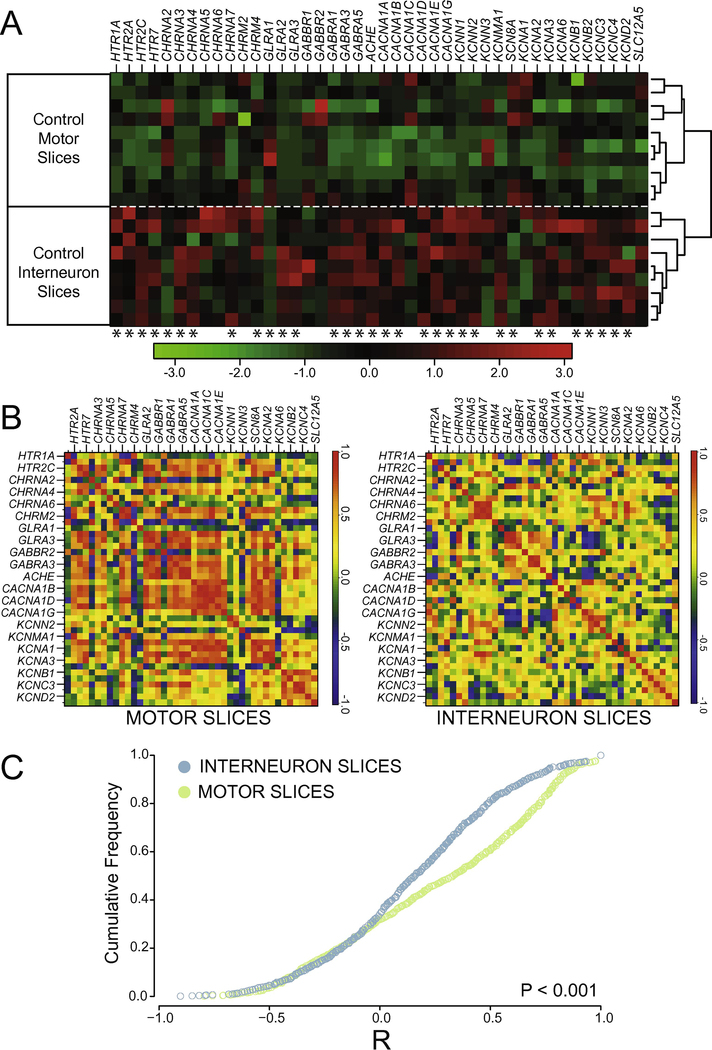
Figure 2.
Channels and receptors are differentially expressed in interneuron- and motor neuron-enriched slices. A) Heat-map showing relative transcript levels of receptor and channel subtypes across different slice types of control (uninjured) animals. Data are expressed as a column Z-score where relative distance of a given expression value from the group mean is represented by color intensity. Each row is a different slice sample, which are clearly grouped into two distinct nodes by slice class as a result of post-hoc clustering. Genes were arbitrarily grouped based on functional subtypes of receptor and channel class. Asterisks under each column represent significantly different transcript levels between interneuron and motor neuron slices for a given gene (after Two-Way ANOVA, see Methods). B) Co-expression correlations among measured transcripts also differ between slice types. For each slice level from control animals, a correlogram was generated that displays the mean R-values for Pearson correlation tests as heat-mapped pixels for each pairwise comparison. Each X– Y coordinate represents one R-value for a given pairwise comparison. Along the diagonal is the autocorrelation for each gene, resulting in an R-value of 1.0 (red). Labels for every-other gene in the analysis are provided on the x- and y-axes for clarity, but both axes contain all genes used in the study in the same order. C) Cumulative distribution functions from the data shown in panel B reveals a significantly different distribution of R values, with higher co-expression in control MNslices (N = 10) than INslices (N = 9) between interneuron- and motor neuron enriched slices (D = 0.209, P < 0.001; Two-sample K-S test).

