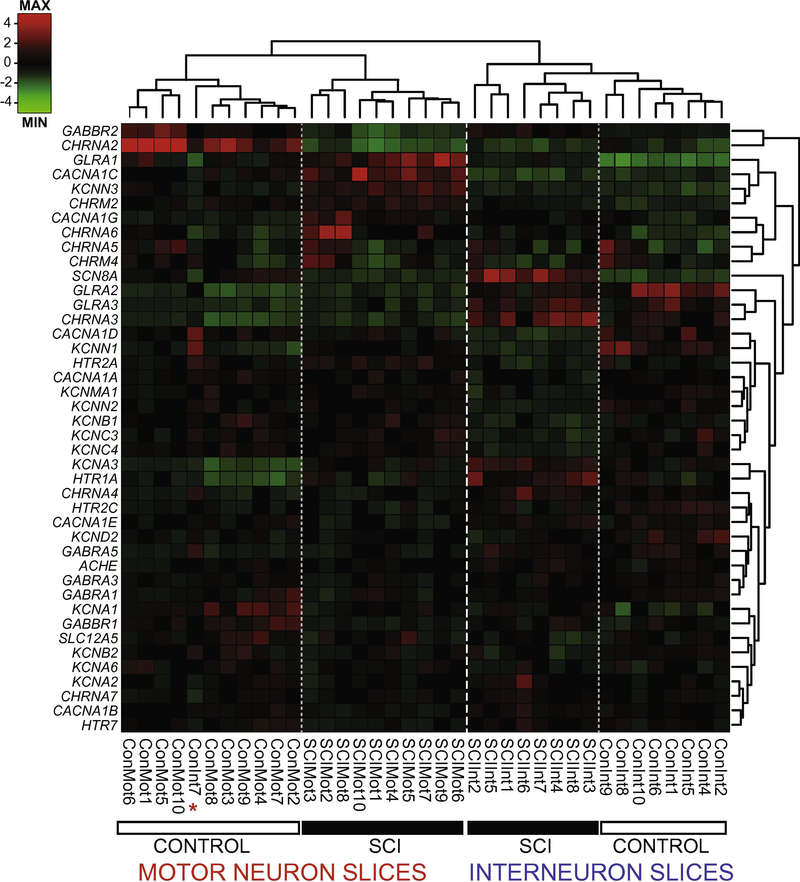
Figure 3.
Ion channel and receptor transcript profiles correspond to slice level and injury state in lumbar spinal cord. Dendrograms and heat map of individual slice samples (columns) from control and SCI motor- and interneuron-containing slices for channel and receptor transcript levels (rows). Hierarchical clustering of sorted slice expression profiles distinctly associated samples from each of the four groups, with one exception (red asterisk). Con = control, SCI = injured, Mot = motor neuron-enriched slices, Int = interneuron-enriched slices. Relative expression is indicated by Z-score based on the average transcript levels for each gene (rows), and not each sample (columns).

