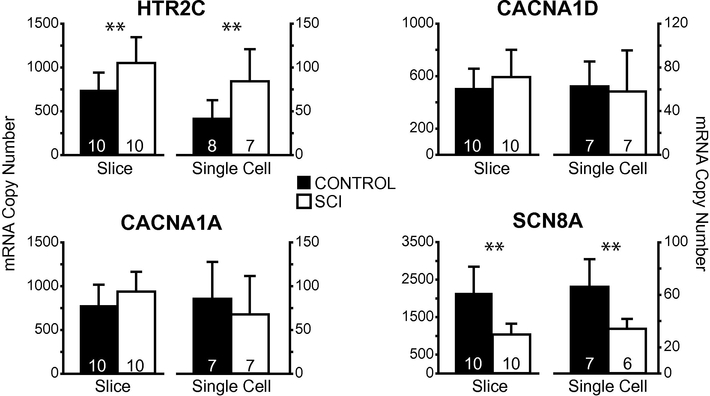
Figure 6.
Single motor neuron gene expression analyses recapitulate transcript levels in whole slices. Mean ± SD copy numbers of four genes of interest across experimental groups (control and injured) in both slices and single motor neurons. Significant differences (p < 0.05; t-test) between control and injured samples are shown with **. Note, while our post-hoc analyses following two-way ANOVA did not have the statistical power to detect significant differences in HTR2C in motor neuron slices (see Figure 5), a direct comparison with t-test reveals this difference in both slices and single motor neurons. Sample sizes indicated in each bar.

