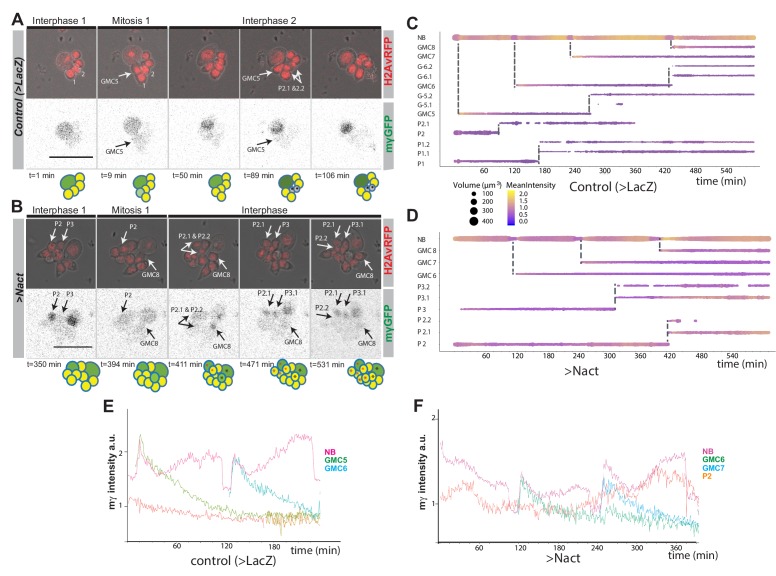
Figure 2. Live-imaging of Ε(spl)mγ-GFP expression in cultured NB lineages.
(A, B) Time points from time lapse movie of (A) wild type (>LacZ) and (B) Nact expressing NB lineage, Histone-RFP (red, H2Av-RFP) marks all nuclei, corresponding Ε(spl)mγ-GFP levels in grey scale below. Ε(spl)mγ-GFP is rapidly extinguished in NB progeny in wild-type and in Nact expressing lineages but appears in some progeny after a delay. Time is indicated below each panels and cartoons summarise the cell populations in each lineage. NBs are show in darker shades of green, GMCs in yellow, newly born GMCs in pale green and neurons in grey. NB-like cells are shown in green. Coloured asterisks indicate cells coming from the same ancestor. White arrows indicate cells arising from a mitotic division. Numbers correspond to different cells indexed in the following diagrams. Scale bar 25 μm. (C, D) Bar chart diagram showing the progression over time of each cell in a wild-type NB lineage (C) or of selected NB progeny over time from one Nact expressing lineage. The diameter of the bar represents cell size and the colour represents expression levels of Ε(spl)mγ-GFP according to the scale (Blue, low to yellow, high). Dashed lines indicate mitotic events and the emerging daughter cells. (E, F) Diagrams depicting changes in the intensity of E(spl)mγ-GFP in NBs and their progeny over time from control (E) and Nact-expressing (F) NB lineages. Note the decay in E(spl)mγ-GFP levels in the newly born GMCs in both control and Nact lineages and the re-expression of E(spl)mγ-GFP in an older Nact progeny P2.

