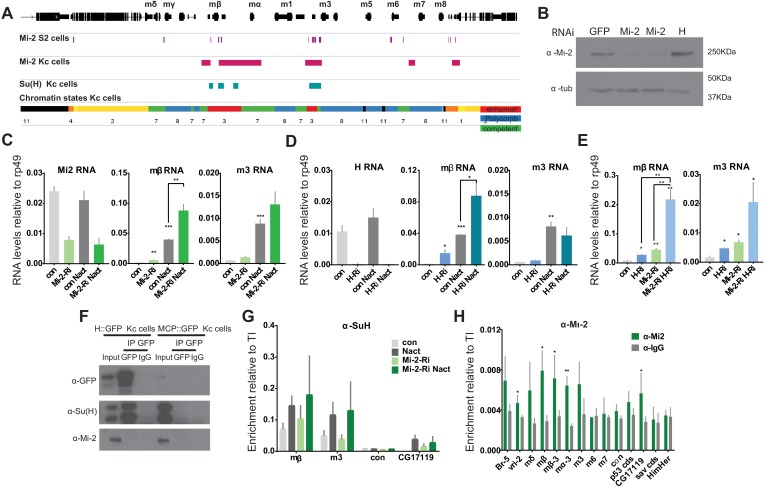
Figure 5. Loss of Mi-2 leads to de-repression of E(spl)-C genes.
(A) Genomic region spanning Ε(spl)-C locus with graphs depicting Mi-2 bound regions in S2 cells (purple) (Kreher et al., 2017) and Kc cells (magenta) (modEncode; Ho et al., 2014), Su(H)-bound regions in Kc cells (cyan) (Skalska et al., 2015) and chromatin signatures from Kc cells (Skalska et al., 2015). Gene models are depicted in black. (B) Levels of Mi-2 protein are reduced upon knockdown of Mi-2 via RNAi in Kc cells for 3 days compared to knockdown of GFP or Hairless via RNAi. Anti-tubulin is a control for loading. (C, D) Fold change in RNA levels in Kc cells upon knockdown of Mi-2 (C) or Hairless (D) compared to control conditions (con: GFP RNAi) and to cells with Notch activation (Nact). Note that E(spl)mβ and E(spl)m3 are both significantly de-repressed in Notch-off state and show even higher increase in expression in Notch-on state. (E) Fold change in RNA levels in Kc cells upon combined knockdown of Mi-2 and Hairless compared to control conditions and single knockdown of Mi-2 or Hairless. Note additive effects on E(spl)mβ and E(spl)m3 de-repression in combined knock-down conditions. (F) Mi-2 does not directly interact with Hairless. Immunoprecipitations with anti-GFP from Kc cells expressing Hairless-GFP or MCP-GFP as control, Su(H) is co-purified with Hairless but not Mi-2. (G) Enrichment of Su(H) is indicated at E(spl)-C or regions in Kc cells as revealed by ChIP in control (grey) or Mi-2 knockdown (for 3 days, green) conditions in Notch off (light shading) and Notch active (EGTA treatment 30 min; dark shading). Su(H) recruitment in Notch active and in control conditions is not altered by knockdown of Mi-2. (H) Enrichment of Mi-2 at indicated positions in E(spl)-C or other regions in Kc cells as revealed by ChIP. (P values: *0.01 < P < 0.05, ** 0.001 < P < 0.01, ***p<0,001, Multiple t-tests).


