. 2019 Feb 18;8:e39598. doi: 10.7554/eLife.39598

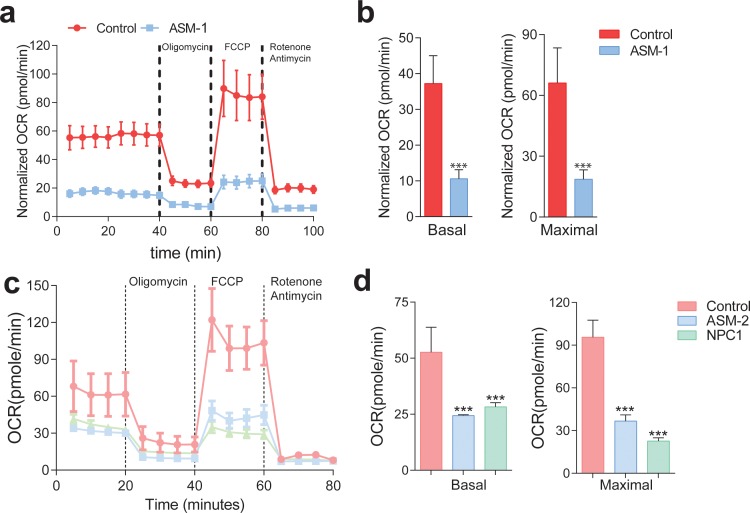
Figure 3. Mitochondrial function and mitochondrial mass are impaired in acid sphingomyelinase (ASM)- and NPC1-deficient patient fibroblasts.

(a,c) ASM- and NPC1-deficient fibroblasts have substantially lower O2 Consumption Rate (OCR) than controls. OCR was measured using whole cells, sequentially in basal conditions (complete medium), after oxidative phosphorylation inhibition using the ATPase inhibitor oligomycin, after uncouling the respiratory chain from oxidative phosphorylation using the uncoupler FCCP, and after inhibition of the respiratory chain using complex I inhibitor rotenone and complex III inhibitor antimycin. The measurements were made in a 96-well plate using a SeaHorse Extracellular Flux analyser. The mean ± s.e.m. of at least eight wells per cell line is plotted over time. OCR was normalized to the amount of protein in each well. (b,d) Reduced basal and maximal (uncoupled) OCR in ASM1-deficient fibroblasts quantified from the curves in (a) and in ASM2- and NPC1- deficient fibroblasts quantified from profiles in (c) and bar graphs are presented as mean ± s.e.m. T-test p-value ***p<0.001, n = 3.

Figure 3.

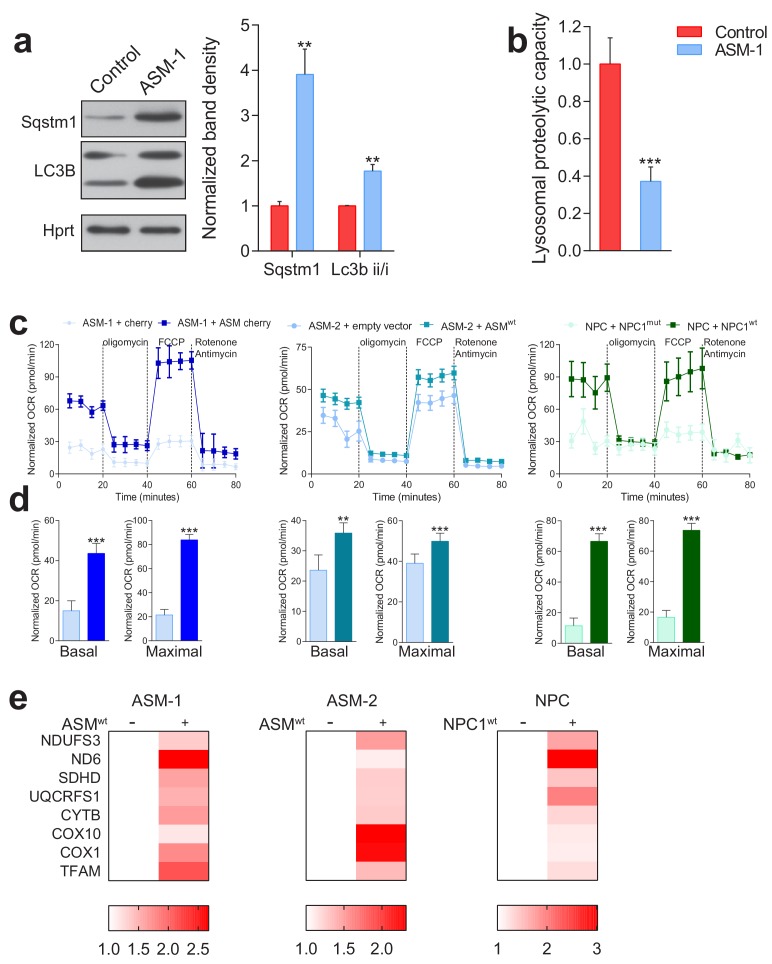
Figure 3—figure supplement 1. Validation of lysosomal defects in patient fibroblasts and causal relationship of defects to mitochondrial biogenesis and function.

Figure 3—figure supplement 1.

The ASM-1 patient cells used in this manuscript have 5% left of acid sphingomyelinase activity, and present the expected signs of lysosomal impairment, specifically (a) decreased autophagic capacity with accumulation of autophagic substrates (p62 also known as Sequestosome 1, Sqstm1) and autophagosomes, as assessed by the autophagosomal marker LC3B-II. Blots are representative of biological triplicates and adjacent plots are depicted as average ± s.e.m., n = 3. T-test p-value **p<0.01 (b) decreased lysosomal proteolytic capacity, as assessed by the rate of DQ-BSA degradation by the lysosomal proteases in whole cells normalized to protein content. Quantification represents mean ± s.e.m., n = 3 (c–e) transfection of all patient lines with the corresponding wildtype protein rescues mitochondrial respiration as assessed by increased OCRs in ASM deficient lines with cherry ASM overexpression and in NPC1 deficient line with NPC1wt overexpression. Quantifications are presented underneath each seahorse profile in panel d) as average ± s.e.m., n = 2 with eight technical replicates per condition. T.test p-value **p<0.01 and ***p<0.001. (e) Mitochondrial gene expression, as assessed by qPCR, is increased in all patient lines following overexpression of corresponding wiltype proteins. The data is presented in a heatmap for n = 3, in which red denotes increased expression in wiltype protein-overexpressing patient lines compared to white, which represents no change relative to the control values.
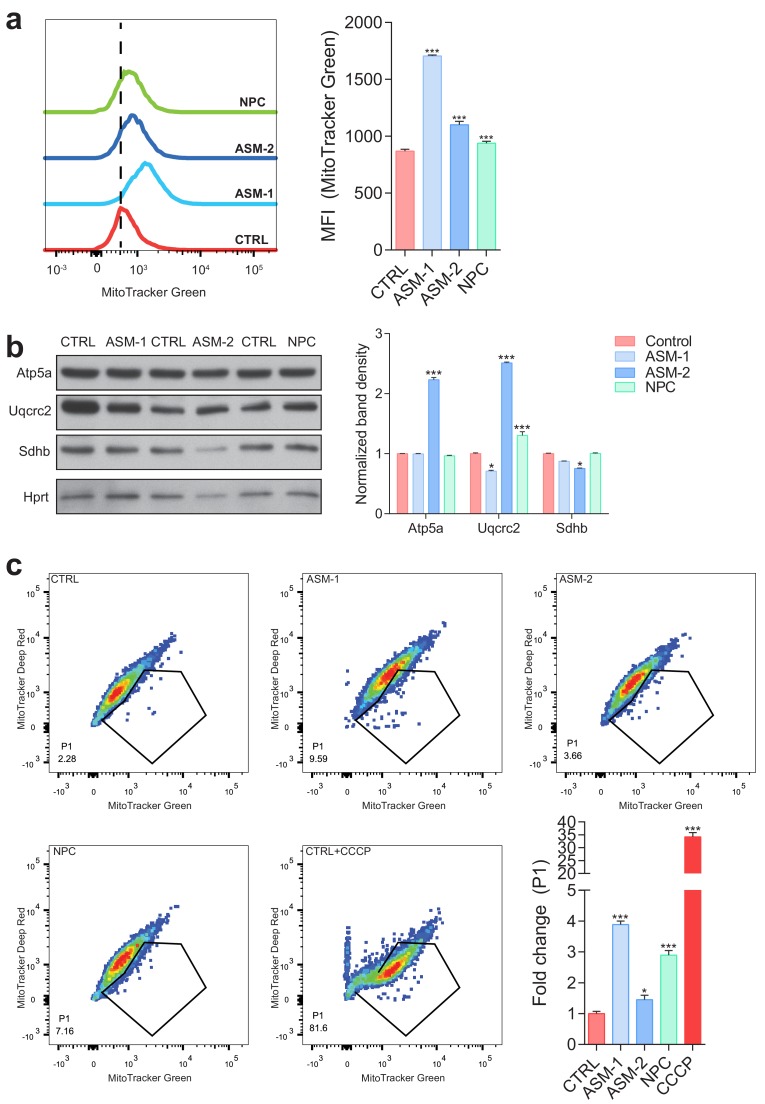
Figure 3—figure supplement 2. Increased content of dysfunctional mitochondria in ASM-deficient and NPC fibroblasts.

Figure 3—figure supplement 2.

(a) Mitochondrial mass was assessed by flow cytometry with MitoTracker Green staining. Histogram plot shows a right shift in intensity of MitoTracker Green dye in ASM and NPC patient cells relative to controls. Quantifications are depicted as mean fluorescent intensity (MFI) ± s.e.m., n = 5 with two technical replicates each. (b) Mitochondrial mass as assessed by western blot of mitochondrial protmean ± s.e.m., n = 3. T-test p-value *p<0.05, ***p<0.001. (c) Co-staining of MitoTracker Green and MitoTracker Deep Red dyes in ASM and NPC deficient fibroblasts showing increased population of dysfunctional mitochondria (MitoTracker Green positive and MitoTracker Deep Red negative population (P1) by flow cytometry). Quantification depicts fold change of P1 population shown as average ± s.e.m., n = 5 with two technical replicates.
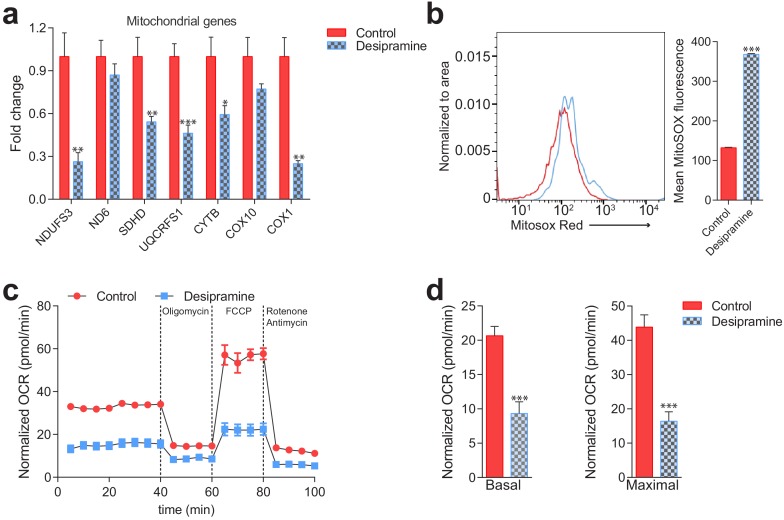
Figure 3—figure supplement 3. Mitochondrial deficits in control fibroblasts treated with desipramine 40 µM for 72 hr (inhibitor of acid sphingomyelinase).

Figure 3—figure supplement 3.

(a) Transcript levels of mitochondrial genes depicted as mean ± s.e.m., n = 3. T-test p-values *p<0.05 **p<0.01 ***p<0.001. Sterile distilled water used as vehicle control. (b) Increased mitochondrial superoxide levels, as assessed by MitoSox intensity, in desipramine-treated cells measured by flow cytometry. The plot shows MFI ± s.e.m., n = 5. T-test p-values ***p<0.001 (c–d) Decreased Oxygen consumption rate (OCR) in desipramine-treated fibroblasts under the indicated conditions, quantified in panel d) as average ± s.e.m., n = 2 of at least eight technical replicates each. Sterile distilled water used as vehicle control.
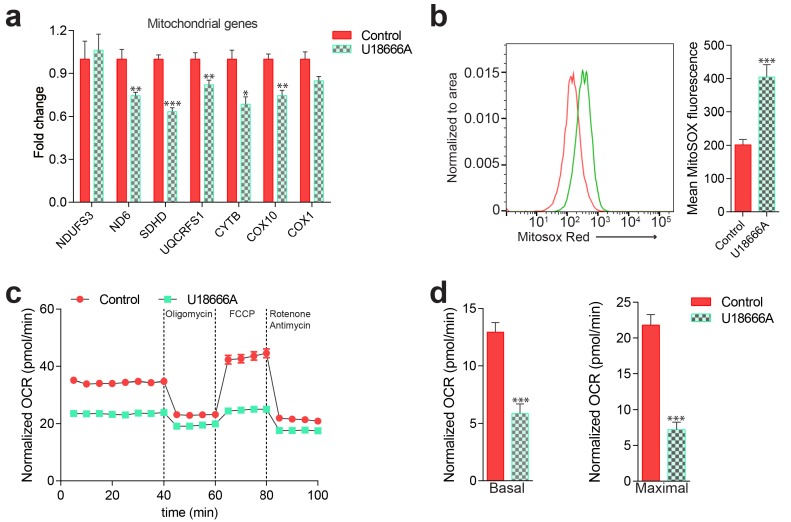
Figure 3—figure supplement 4. Mitochondrial deficits in control fibroblasts treated with U18666A 10 µM for 72 hr (inhibitor of NPC1).

Figure 3—figure supplement 4.

(a) Mitochondrial gene expression levels in U1866A treated cells shown as mean ± s.e.m., n = 3. T-test p-values *p<0.05 **p<0.01 ***p<0.001. DMSO used as vehicle control. (b) Increased mitochondrial superoxide levels, as assessed by MitoSox intensity, in U18666A-treated cells quantified as mean ± s.e.m., n = 5. T-test p-values ***p<0.001 (c–d) Decreased Oxygen consumption rate (OCR) in U18666A-treated fibroblasts under the indicated conditions, quantified in panel d) as mean ± s.e.m. n = 2, with eight technical replicates. DMSO used as vehicle control.