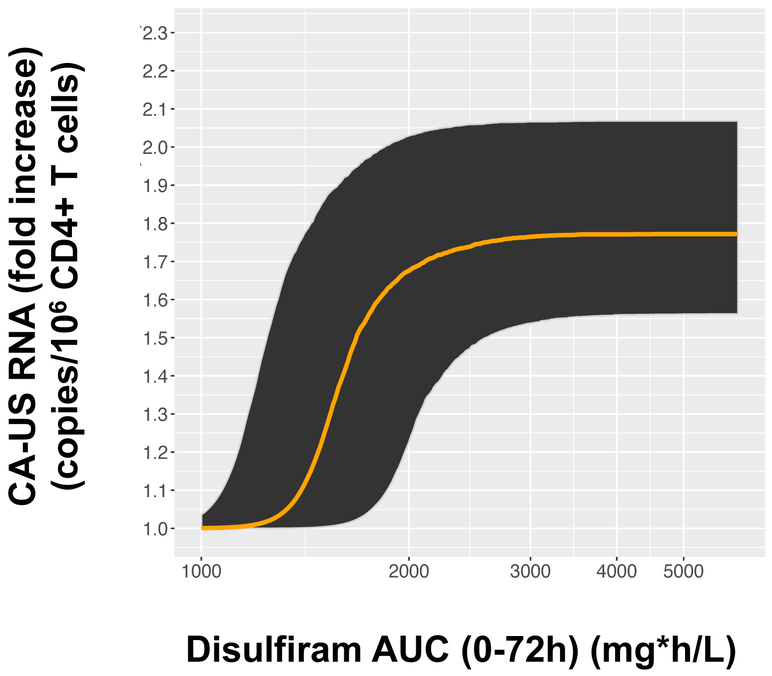
Figure 3.
Median fold-change exposure-response curve for cell-associated unspliced HIV-1 RNA (copies/106 CD4+ T cells) versus AUC of disulfiram concentrations (mg*h/L) over 72 hours in a model including all three baseline values. For concreteness, we plot the model’s predicted multiplicative effects as the resulting copies/106 CD4+ T cells after disulfiram administration. At each AUC value, the model estimates that 95% of the population will have a response within the shaded region, based on the estimated random effect parameters for AUC50 and Emax.

