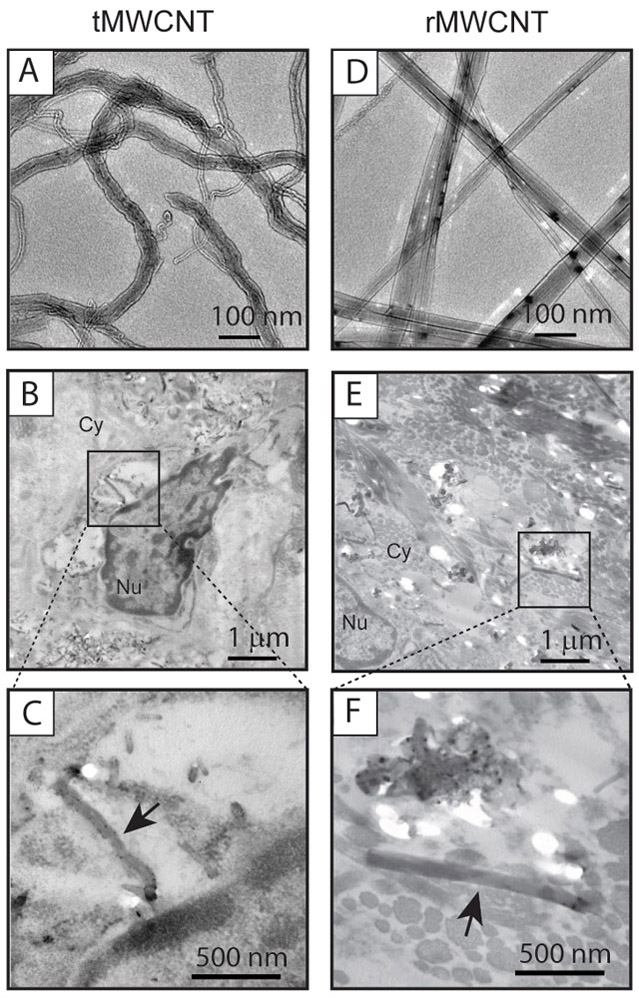
Figure 1.

TEM images of nanomaterials used in the study A) tMWCNTs and D) rMWCNTs. B) TEM image of tMWCNTs in lung granuloma from a p53+/− mouse at 11 months post-exposure. Cy indicates cytoplasm, and Nu indicates the nucleus. C) Inset showing a representative tMWCNT (arrow) near the nuclear membrane of a phagocytic cell. E) TEM image of rMWCNTs in granulomatous connective tissue from a p53+/− mouse at the end of the 11-month study period. F) Inset showing a representative rMWCNT (arrow).
