Figure 1:
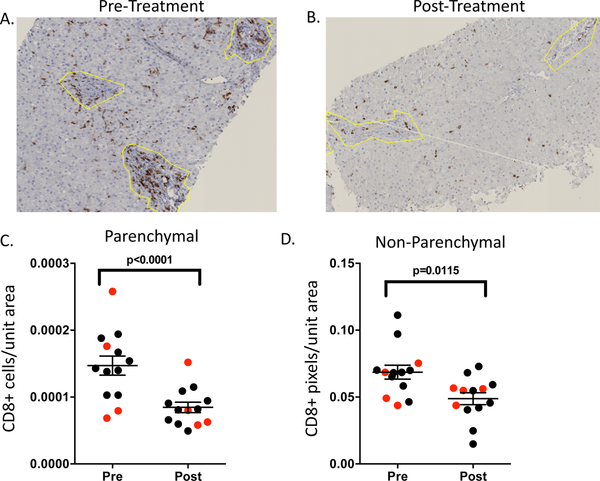
Representative pre- (A) and post- (B) treatment FFPE liver sections stained with an anti-CD8 antibody. Quantitative changes in CD8 signal intensity in regions demarcated as parenchymal (C) or non-parenchymal (D) for 13 patients with available biopsies. Data from subjects who achieved SVR are in black and data from subjects who relapsed are in red. Cell count or pixel count per surface area were determined as described in the methods section. Non-parenchymal regions are denoted by the yellow line. Statistical analysis was by paired t-test considering all subjects, with mean and standard error shown.

