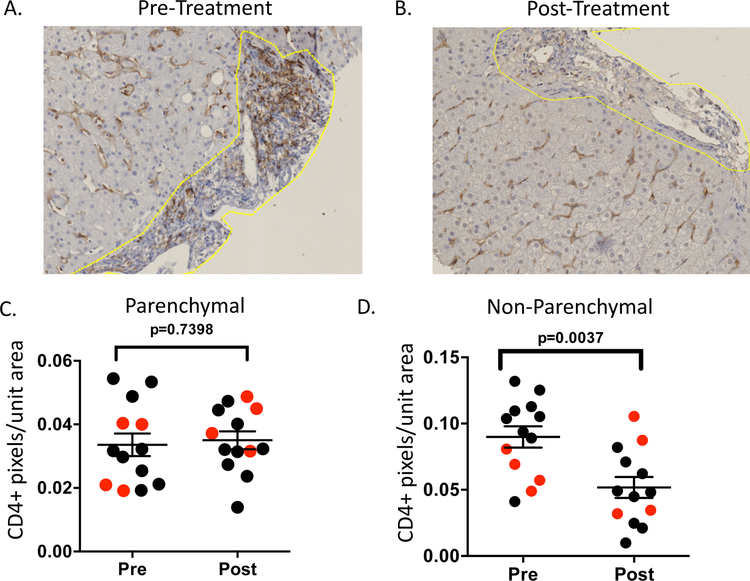
Figure 2:
Representative pre- (A) and post- (B) treatment FFPE liver sections stained with an anti-CD4 antibody. Quantitative parenchymal and non-parenchymal CD4 signals (C-D) were quantitated by pixel count to infer cellular density from 13 patients (SVR =9 shown in black, relapse =4 shown in red). Non-parenchymal regions are denoted by the yellow line. Statistical analysis is by paired t-test considering all patients.

