
Figure 1: LI scores for each foraging group including controls that are not pre-exposed to the odours.
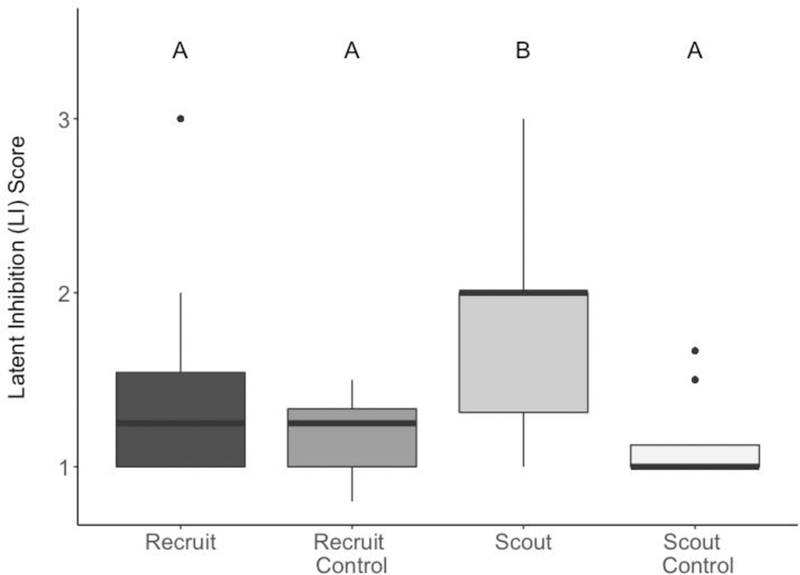
Different letters indicate significant differences based on a Dunn post-hoc test. High scores indiciate more responses to the novel odour, whereas Scores close to 1 indicate equal responses to the novel and the familiar odour, whereas higher scores indiciate more responsiveness to a novel odour. n=27 recruits, 10 recruit controls, 34 scouts, and 11 scout controls. For this boxplot and all following: thick horizontal bars are medians, boxes are 25–75th percentile, lines are 1.5 * IQR, points are outliers.