
Figure 2: Learning curves of bees tested for LI to illustrate qualitative similarities in LI.
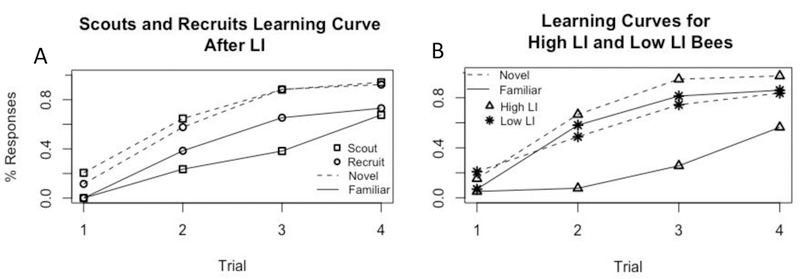
Both graphs are from the same bees, grouped by either LI score or foraging behaviour. (A) Learning curves of bees score defined as scouts and recruits when collected; n=34 scouts, 26 recruits. (B) Learning curves of bees as defined by their LI scores. High LI bees are defined as any bee with a score of 1.33 or higher (or (3 responses to a+1)/(2 responses to x+1)), n= 39 “high LI” bees, 43 “low LI” bees.