
Figure 4: Concentrations of biogenic amines for scouts, recruits, and controls after PER training and LI determination.
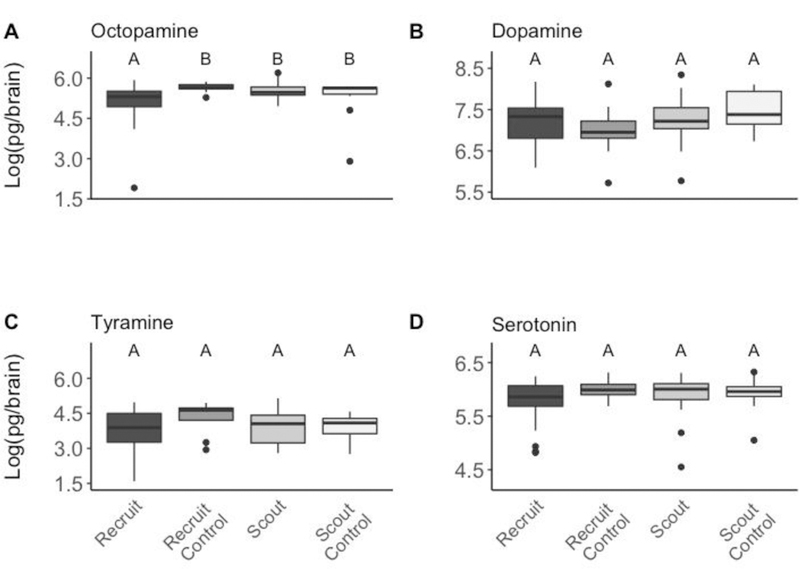
Only octopamine differs significantly between scouts (n=34), recruits (n=27), and controls (n=11 scout controls, 10 recruit controls). Controls are individuals that went through the LI procedure but received no odour during pre-exposure. Unique letters indicate statistically significant differences according to a Dunn post-hoc test.