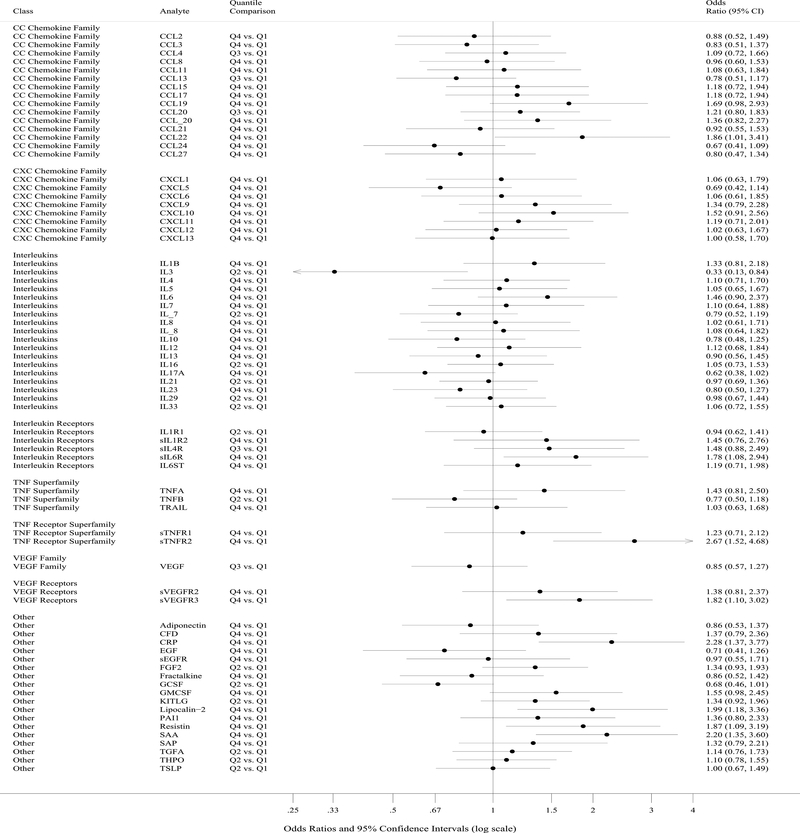
Figure. Summary plot of associations between circulating markers and oesophageal adenocarcinoma risk comparing the highest with the lowest quantile.
Each circle represents an odds ratio estimate and the width of the intersecting horizontal line the 95% confidence interval. Circulating markers are ordered by class and the quantile comparison is shown for each given marker.

