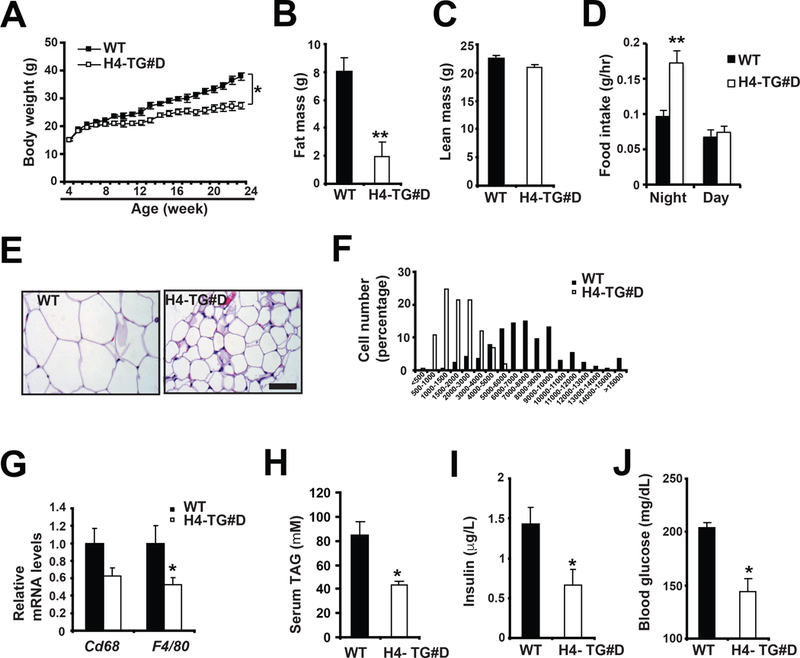
Figure 5. H4-TG mice showed reduced adiposity and improved metabolic performance under normal chow.

A, Body weight in male WT and H4-TG#D mice on normal chow. Sample sizes: n=24 for each genotype. Fat mass (B), lean mass (C) and food intake (D) of ~ 26-week-old WT and H4-TG#D mice. Sample sizes: n=6 for each genotype. Representative H&E staining of eWAT (E) and adipocyte size distribution (F) in above mice. Scale bar: 50μM. Total adipocytes counted: WT (n=878) and H4-TG#D (n=1319). G, q-PCR analysis of mRNA levels of macrophage marker Cd68 and F4/80 in eWAT of above mice. Serum TAG (H), insulin (I) and glucose (J) levels in ~ 26-week-old WT and H4-TG#D mice after 4 hour fasting. Sample sizes: n=6 for each genotype.
