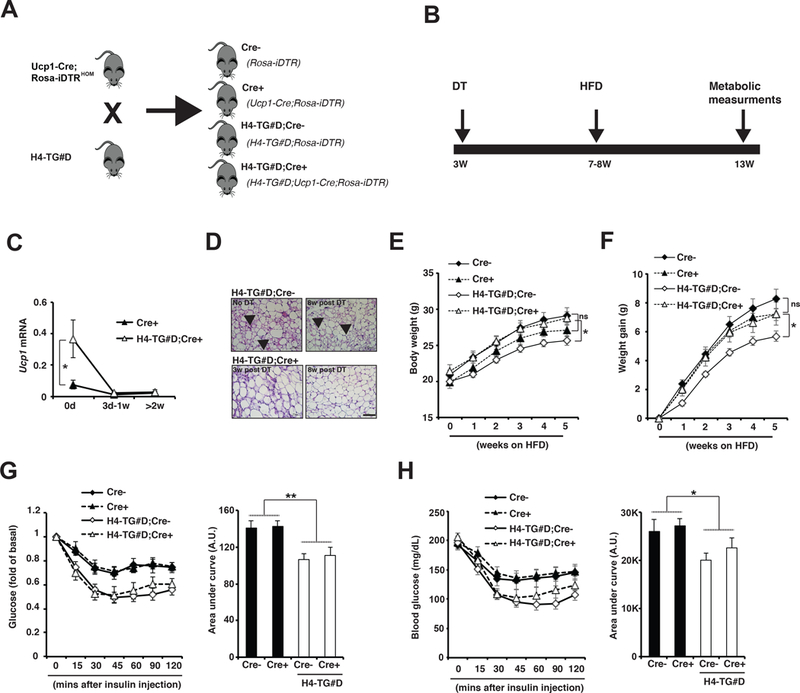
Figure 7. H4-TG mice with beige adipocyte ablation were not protected against HFD-induced obesity.

A, H4-TG#D mice were crossed to Ucp1-Cre;Rosa-iDTRHOM mice to generate the following four groups of mice: Cre- (genotype: Rosa-iDTR), Cre+ (genotype: Ucp1-Cre; Rosa-iDTR), H4-TG#D;Cre- (genotype: H4-TG#D;Rosa-iDTR), and H4-TG#D;Cre+ (genotype: H4-TG#D;Ucp1-Cre;Rosa-iDTR). B, Experimental scheme. The four groups of mice were injected with DT at three-week of age to ablate Ucp1+ brown and beige adipocytes. Four to five weeks later, the brown adipocytes were fully regenerated in iBAT, while beige adipocytes remained ablated in iWAT. Then the mice were fed with HFD for additional 4–5-weeks for metabolic measurements. C, q-PCR analysis of Ucp1 mRNA levels in iWAT from Cre+ and H4-TG#D;Cre+ adult mice before, 3 days to 1 week, and more than 2 weeks after DT injection. Sample sizes: 0d Cre+ (n=18), 0d H4-TG#D;Cre+ (n=19), 3d-1w Cre+ (n=4), 3d-1w H4-TG#D;Cre+ (n=7), >2w Cre+ (n=5) and >2w H4-TG;Cre+ (n=8). D, Representative H&E staining of iWAT from H4-TG#D;Cre- and H4-TG#D;Cre+ mice at different time-points before and after DT injection. Scale bar: 50μM. Arrows: multilocular beige adipocytes. E, F, Body weight and weight gain of Cre-, Cre+, H4-TG#D;Cre- and H4-TG#D;Cre+ mice under HFD. Sample sizes: Cre- (n=18), Cre+ (n=18), H4-TG#D;Cre- (n=17) and H4-TG#D;Cre+ (n=13). G, Serum glucose levels (per fold of basal) in Cre-, Cre+, H4-TG#D;Cre- and H4-TG#D;Cre+ mice after 5-week HFD. AUC (area under curve) of ITT also shown. H, Serum glucose levels (per mg/dL) in Cre-, Cre+, H4-TG#D;Cre- and H4-TG#D;Cre+ mice after 5-week HFD. AUC (area under curve) of ITT also shown. AU: Arbitrary Unit. Sample sizes: Cre- (n=18), Cre+ (n=18), H4-TG#D;Cre- (n=17) and H4-TG#D;Cre+ (n=13).
